XRP/USD has seen notable price movements recently, reflecting both market volatility and technical patterns. As of the latest data, XRP is trading around the $0.5375 level, showing slight upward momentum. The market’s reaction to both macroeconomic factors and crypto-specific developments has influenced these price changes. In this analysis, we break down the trading pair’s performance using the 1-day, 5-day, and 6-month charts to derive potential trade ideas and strategic insights.
1-Day Chart Analysis

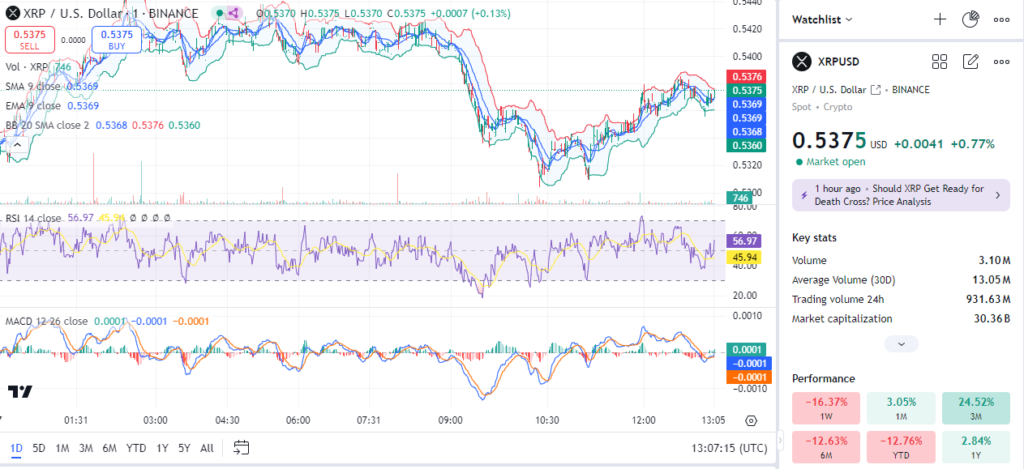
On the 1-day chart, XRP/USD is consolidating near the $0.5375 price range. The Simple Moving Average (SMA) for 9 periods is seen hovering around $0.5369, indicating that the short-term trend is relatively stable but lacks strong upward momentum. The Exponential Moving Average (EMA) close of $0.5368 suggests a similar short-term market stance, with the price trading slightly above these moving averages.
The Relative Strength Index (RSI) for 14 periods reads around 56.97, placing it just below the overbought threshold of 70. This suggests that the market is neither heavily overbought nor oversold, giving a neutral indication. However, if the RSI begins to rise above 60, it could signal potential bullish momentum.
The MACD (Moving Average Convergence Divergence) indicator shows a very narrow difference between the signal line and the MACD line, indicating a lack of strong momentum. This suggests that traders should be cautious about committing heavily to a position until a more decisive signal emerges.
Read More: ETH/USD Technical Analysis: Key Levels and Trade Ideas – Oct 7
5-Day Chart Analysis

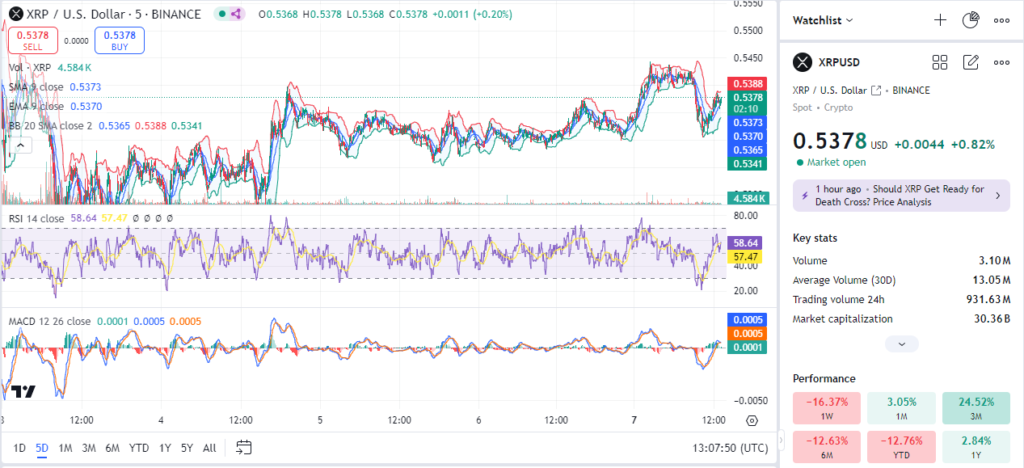
Moving to the 5-day chart, XRP/USD exhibits more significant fluctuations, reflecting increased trading activity. The SMA and EMA lines for this period are closely aligned around the $0.5373 level, indicating a relatively steady trend with small upward biases. The Bollinger Bands, however, display slight widening, suggesting a potential increase in volatility in the near term.
The RSI stands at 58.64, closer to the upper neutral zone, indicating a potential buildup of buying pressure. The price consistently trading near the upper Bollinger Band suggests a possible breakout scenario if buyers manage to push past resistance levels near $0.54. However, this could also be a point of exhaustion, requiring traders to keep a close eye on any shifts in volume and RSI movements.
The MACD on the 5-day chart shows a slight bullish crossover, where the MACD line is crossing above the signal line. This crossover might signal the start of a short-term bullish trend, but confirmation with stronger volume would be crucial for validation. A cautious approach is recommended here due to the overall market sentiment.
6-Month Chart Analysis

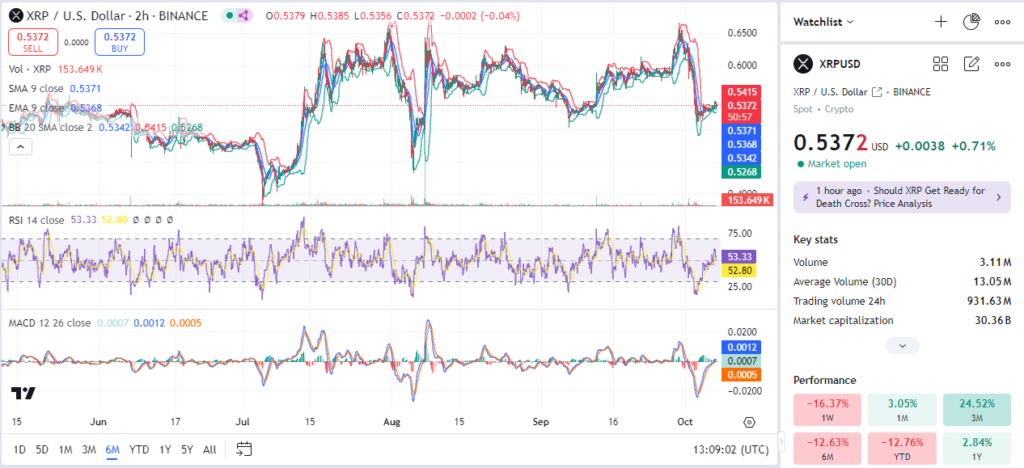
The 6-month analysis reveals a broader perspective on XRP/USD’s performance. The pair has faced notable resistance around the $0.60 mark, which has repeatedly rejected further upward movements. The SMA and EMA values are currently around the $0.5361 level, showing that the recent downturn has brought prices closer to these averages, potentially setting up a new support level.
The RSI at 53.33 suggests that XRP is recovering from earlier oversold conditions. This could mean that the downtrend might be bottoming out, with room for a moderate recovery if buying interest continues. However, with the current market being highly sensitive to macroeconomic developments, a sustained uptrend might face challenges unless there is a significant shift in market sentiment.
MACD readings on the 6-month chart display a slow convergence towards a potential bullish crossover, though it is yet to be confirmed. Traders should watch for a break above $0.55 to signal a continuation of this potential uptrend, with $0.54 acting as a key support level during potential pullbacks.
Read More: BTC/USDT Technical Price Analysis: What’s Next for Bitcoin? – Oct 7
Trade Ideas and Strategy
Based on the above analysis, here are some actionable trade ideas for XRP/USD:
- Short-term Long Position:
- Entry Point: Consider entering a long position if XRP/USD breaks above $0.54 with strong volume confirmation.
- Target: The first target could be set at $0.555, with a potential extension to $0.57 if the bullish momentum sustains.
- Stop-Loss: A tight stop-loss at $0.53 is advisable to manage downside risk.
- Risk Management Tip: Adjust the stop-loss to breakeven once the price hits the $0.55 mark to secure gains and reduce exposure.
- Swing Trade Strategy:
- Entry Point: For those looking at a longer-term approach, consider buying near the support level of $0.53 if a clear bounce is observed.
- Target: Look for price levels around $0.58 to $0.60 as potential profit-taking zones, considering the historical resistance seen around these levels.
- Stop-Loss: A stop-loss below $0.525 can help mitigate risks in case of a downward trend continuation.
- Risk Management Tip: Use a trailing stop once the price moves past $0.55 to lock in profits while giving room for potential upside.
- Bearish Scenario – Short Position:
- Entry Point: If XRP/USD fails to hold above the $0.54 level and starts showing declining RSI and MACD signals, consider shorting around $0.538.
- Target: Potential downside targets could be $0.525, followed by $0.51 if selling pressure intensifies.
- Stop-Loss: A stop-loss at $0.545 would help protect against sudden upward moves.
- Risk Management Tip: Scale down the position size to ensure better control over losses if the market shows unpredictable behavior.
Conclusion
XRP/USD’s current trading pattern shows a mixed sentiment, with potential short-term bullishness that could be offset by macroeconomic factors. The technical indicators across the 1-day, 5-day, and 6-month charts provide critical insights for traders, highlighting key support and resistance levels that could define the trading pair’s future movements. By applying disciplined risk management strategies, traders can navigate the market’s volatility and capitalize on emerging trends. As always, staying updated with market developments is crucial for making informed trading decisions in this ever-evolving cryptocurrency space.


