
Are we on the verge of a fresh uptrend for VELO? Recent trading activity shows promising signs of recovery, even after a noticeable pullback from this token’s February highs near $0.040. With traders eyeing the current price hovering around $0.015, the crucial question is whether VELO’s momentum can carry it above $0.020—and possibly beyond. Below is a detailed breakdown, supported by chart data and technical indicators, to help you make sense of where VELO might be headed.
Read More: The Best Crypto Indicators for Long-Term Investing
1. Current Market Overview
VELO has shown a gradual yet discernible shift in sentiment after reaching a local floor near $0.013 earlier this month. Over the past 24 hours, the price has climbed to around $0.015, indicating a mild but sustained bounce. Zooming out on the 2-hour chart reveals that despite an overarching downtrend from its December–January peak, VELO is attempting to carve a new higher low. This subtle bullish tilt can also be observed on the 1-hour and 5-minute charts, where short-term rallies have displayed modest strength.
From a market-cap perspective, VELO currently stands around $111 million, with about $21 million in daily trading volume. Though trading activity is down from the previous day, the upward price movement suggests that buyers are not entirely deterred. Coupled with a circulating supply of about 7.39 billion VELO, the market’s renewed interest hints that many participants still view the token’s recent lows as a potential bargain.
Short-term traders can see from the candlestick patterns on the 1-hour chart that VELO’s dips into the $0.014–$0.0145 range have attracted noticeable buying. This area may now serve as the nearest support zone. The real test, however, will be whether the token can hold above this band should broader crypto markets turn volatile.
2. Technical Indicators & Key Levels
Technical analysis tools show mixed but generally constructive signals for VELO. Here is a quick snapshot:
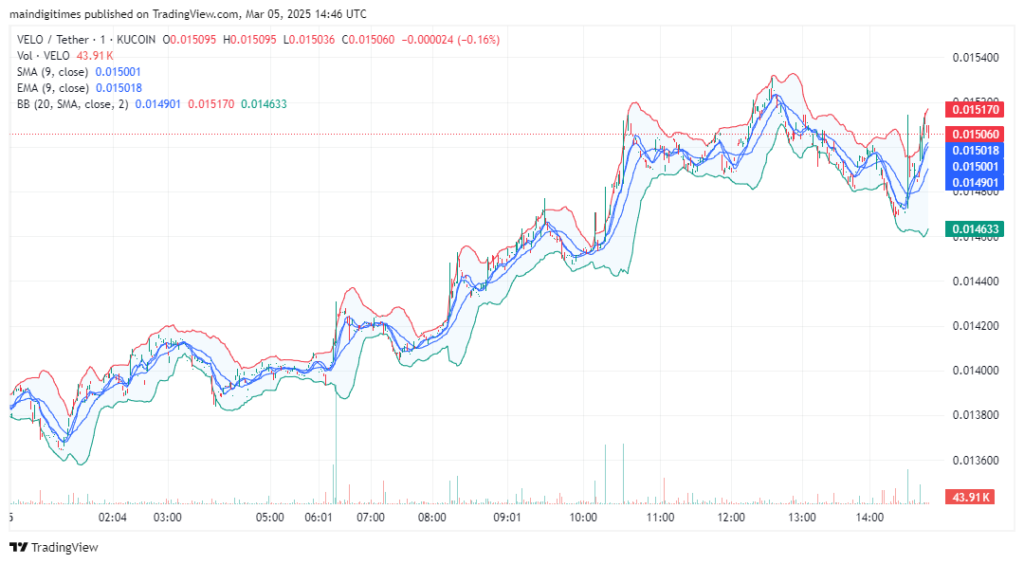
- 9-Period Simple Moving Average (SMA): On the 1-hour chart, the price has managed to stay near or just above the 9-period SMA, which is around $0.015. Holding above this SMA often hints that short-term momentum is on the bullish side.
- 9-Period Exponential Moving Average (EMA): The EMA similarly sits in the $0.0149–$0.015 region. EMA readings confirm the token’s slight upward bias, as VELO frequently bounces from or near this line, suggesting buyers step in at these levels.
- Bollinger Bands (BB): The Bollinger Bands on both the 1-hour and 5-minute charts show contraction followed by mild expansions, indicative of volatile but net-upward price action. The lower band, near $0.0145, has frequently acted as intraday support, while the upper band around $0.0155–$0.016 remains an immediate resistance ceiling.
- Volume Trends: Although 24-hour volume has dipped almost 20%, the sizable daily turnover of over $20 million still points to active participation. If volume spikes again in tandem with price, that would reinforce a bullish trajectory.
Only once in the past week did VELO decisively break below $0.014 support for more than a few hours, suggesting a strong “buy the dip” mentality among traders. Should VELO successfully consolidate above $0.015, the token may gather enough momentum to test the $0.017–$0.018 region.
Read More: Swing Trading vs. Scalping: Which Strategy Suits You Best?
3. Price Outlook and Possible Scenarios
VELO’s mild bullish trend could accelerate if broader market conditions remain favorable. With the token holding its ground above $0.014, the next immediate hurdle is around $0.016–$0.017, a zone that coincides with its upper Bollinger Band on higher timeframes. If buyers manage to push VELO through this region on rising volume, a further climb to $0.020 becomes plausible. This level is both a psychological round number and a previous pivot area from late February.
On the flip side, any renewed sell-off that breaks below the $0.014 mark could see VELO drifting back toward the $0.013 handle—or even lower if the broader crypto market enters a corrective phase. That said, the steady accumulation seen around $0.014 offers some confidence that bulls will defend that level.
Looking further ahead, if VELO can maintain a higher low structure on its 2-hour or daily chart, it stands a reasonable chance of re-testing mid-range levels in the $0.020–$0.025 bracket over the coming weeks. Traders should keep an eye on trading volumes, because a surge in volume around local supports or resistances often signals the next leg of momentum.
In conclusion, VELO’s current technical posture is cautiously bullish, supported by the price floating near a rising SMA and EMA, fairly active trading volumes, and signs of resilient support around $0.014. While no price movement is guaranteed, the path to a $0.020 target appears open if the token can maintain its footing above key supports and rally on higher volume. As always, prudent risk management is essential, given the crypto market’s inherent volatility.