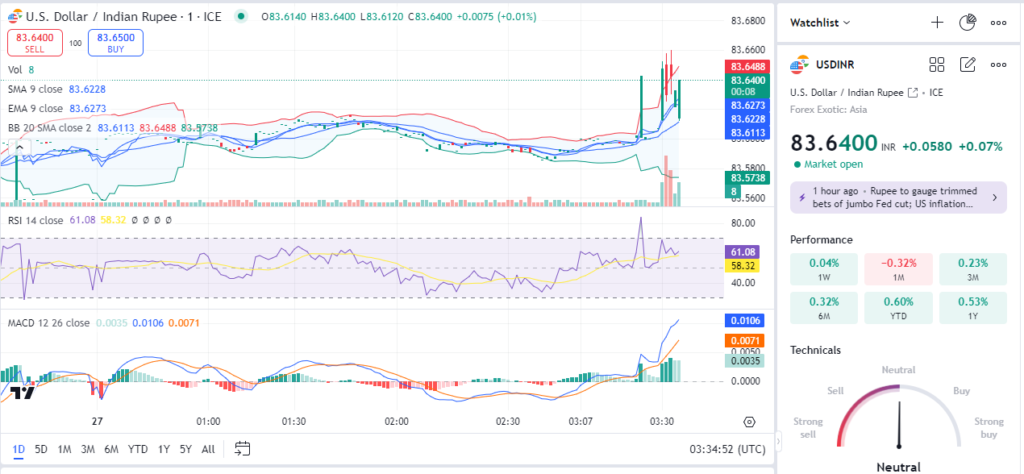
The USD/INR pair has shown a dynamic movement over the past few weeks, reflecting the broader fluctuations in the global forex market. Amid speculations about the US Federal Reserve’s monetary policy adjustments and India’s economic performance, the pair has experienced volatile trading sessions. This report delves into the technical analysis of USD/INR using 1-day, 5-day, and 6-month charts, providing a comprehensive view of its price trajectory and potential trade setups.
1-Day Chart Analysis

The 1-day chart of the USD/INR trading pair indicates a recent spike in price momentum. After consolidating around the 83.61 level, the price surged towards 83.65, reflecting a breakout from a previously established range. Key indicators such as the Simple Moving Average (SMA) and the Exponential Moving Average (EMA) of 9 periods are currently aligned at 83.62 and 83.63, respectively, suggesting that the market sentiment is slightly bullish.
The Bollinger Bands (BB) also indicate a widening spread, pointing towards increased volatility in the market. The upper band stands at 83.6488, and the lower band is at 83.5738, with the price currently hovering near the upper band, indicating overbought conditions. The Relative Strength Index (RSI) is at 61.08, close to the overbought threshold of 70, which could signal a potential retracement in the near term. Meanwhile, the Moving Average Convergence Divergence (MACD) shows a positive crossover, with the MACD line above the signal line, reinforcing the bullish sentiment.
Read More: CAD/USD Technical Analysis: Key Levels and Trade Ideas – Sep 27
5-Day Chart Analysis

On the 5-day chart, the USD/INR pair has shown a more pronounced consolidation phase, with prices fluctuating between 83.58 and 83.65. The SMA and EMA for 9 periods are both converging at around 83.60, indicating a lack of strong directional momentum over the short term. The Bollinger Bands show a relatively narrow range, with the price bouncing off the lower band at 83.574 and testing the upper band at 83.624 multiple times, signifying a lack of clear trend direction.
The RSI stands at 67.89, just below the overbought zone, indicating that while buying pressure remains strong, there is potential for a pullback if selling pressure increases. The MACD, with a slight positive divergence, suggests that the bullish momentum is weak but still present.
Overall, the 5-day chart presents a picture of indecision, with the market participants awaiting clearer signals before committing to a directional bias.
6-Month Chart Analysis

The 6-month chart reveals a broader perspective of the USD/INR trading dynamics. Over this period, the pair has shown a range-bound movement between 82.50 and 83.80, with multiple failed attempts to break above the upper resistance level at 83.80. The SMA and EMA for 9 periods are currently around 83.59, and the Bollinger Bands are relatively tight, indicating reduced volatility in recent months.
The RSI, currently at 52.85, suggests a neutral stance in the market with no immediate overbought or oversold conditions. The MACD is hovering around the zero line, showing no clear trend in either direction. This indicates that the pair is in a consolidation phase, and a significant breakout in either direction could set the tone for the upcoming months.
Read More: GBP/USD Technical Analysis: Key Levels and Trade Ideas – Sep 25
Trade Ideas
Based on the above technical analysis, here are some actionable trade ideas for the USD/INR trading pair:
- Short-term Buy Trade:
- Entry Point: Consider entering a long position near the 83.60 level if the price remains above the 9-period EMA on the 1-day chart.
- Target: Set a target price at 83.75, just below the recent high, to capitalize on the short-term bullish momentum.
- Stop-loss: Place a stop-loss at 83.50 to limit potential downside risk.
- Risk Management: Keep the position size small, as the RSI indicates that the market is approaching overbought levels.
- Short-term Sell Trade:
- Entry Point: If the price breaks below the 83.60 level with increased selling volume, consider entering a short position.
- Target: Aim for a target price of 83.45, near the lower Bollinger Band on the 1-day chart.
- Stop-loss: Place a stop-loss at 83.70 to protect against unexpected reversals.
- Risk Management: Monitor the RSI closely. If it falls below 50, it could indicate further bearish pressure, justifying holding the position longer.
- Medium-term Buy Trade:
- Entry Point: Enter a long position if the price closes above 83.65 on the 5-day chart with strong bullish momentum.
- Target: Target a medium-term price level of 83.80, the upper resistance on the 6-month chart.
- Stop-loss: A stop-loss can be set at 83.50, considering the recent consolidation range.
- Risk Management: Gradually increase the position size if the price continues to gain above 83.65, confirming the breakout.
Conclusion
The USD/INR trading pair is currently in a phase of indecision, with mixed signals from various technical indicators across different time frames. While the short-term outlook appears slightly bullish, the medium-term perspective suggests a consolidation phase. Traders should approach with caution, using tight stop-losses and clearly defined exit strategies to navigate the potential volatility.


