USDC, the world’s second-largest stablecoin by market cap, has garnered renewed attention as its price hovers tightly around the $1.00 mark. With volumes still substantial and the charts showing subtle but notable shifts, many traders wonder if this asset can maintain its crucial peg—or if slight deviations might see it momentarily drift toward $0.99 or climb back above $1.00. Below is a data-driven technical analysis of USDC’s recent performance and a look at where it could be headed next.
Read More: The Best Crypto Indicators for Long-Term Investing
Trend Overview
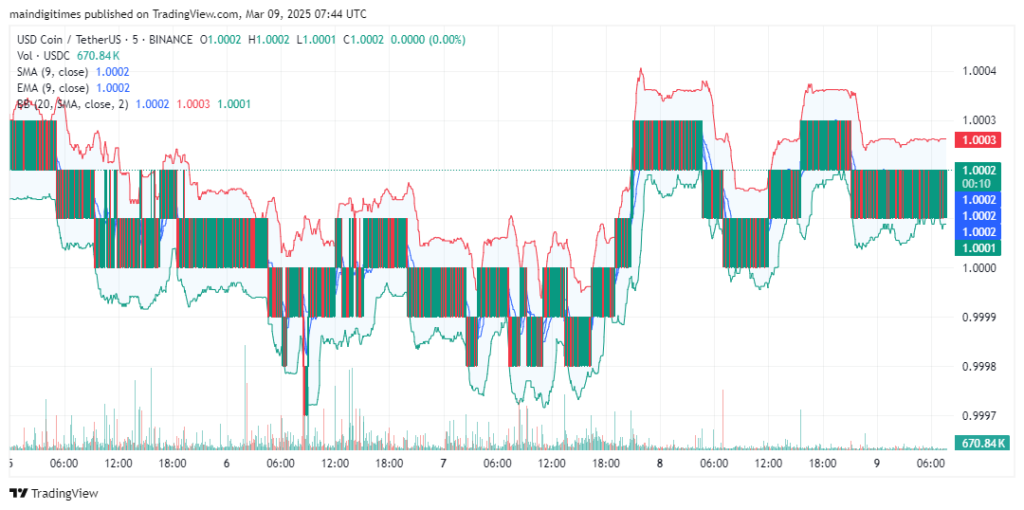
Over the past few days, USDC’s short-term charts (1-minute and 5-minute intervals) reveal fleeting moves between roughly $0.9995 and $1.0003. These minor swings have kept the stablecoin exceptionally close to its dollar peg, reflecting a market where each dip and recovery happens swiftly. From the 1-minute chart, we can see numerous quick red and green bars indicating marginal ups and downs, typically mere fractions of a cent. At first glance, such fluctuations might appear random, but they stem largely from liquidity changes on various exchanges.
Zooming out to the 2-hour and daily timeframes, the pattern is still one of narrow consolidation around $1.00. Even though stablecoins aim to hold a constant value, slight deviations are not unusual—especially during periods of heavier trading volume. Current price action suggests a mildly bullish tilt, evidenced by slightly higher lows on the 2-hour chart, where each dip has generally rebounded toward or above the $1.00 level. Still, we are talking about extremely small percentage shifts, underscoring the stability that defines USDC.
While “bullish” or “bearish” might be strong words for an asset designed to remain near $1.00, the underlying trend can shift if external forces—like sudden changes in supply-demand dynamics—emerge. Right now, the data leans toward a stable environment, with no major sign of a deeper breakdown below $0.99 or a spike above $1.01 in the immediate term.
Technical Indicators and Market Structure
A closer look at three popular technical tools backs up the notion of relative stability:
- Moving Averages (SMA/EMA): On the shorter timeframes, both the 9-period Simple Moving Average (SMA) and 9-period Exponential Moving Average (EMA) hover around $1.0002. This near-perfect alignment signals minimal directional bias. When SMA and EMA values are nearly identical, the market is typically in equilibrium, with no clear push from buyers or sellers.
- Bollinger Bands: These bands, set to a standard 20-period window, envelope the price within a tight corridor between roughly $0.999 and $1.001. The narrow Bollinger Band width highlights low volatility: price activity remains compressed, reflecting a stable market. A sudden spike or dip outside these bands would usually signal a break from equilibrium, but recent data shows no clear breach.
- Volume and Market Cap: The screenshots indicate solid liquidity—USDC’s 24-hour volume often surpasses billions of dollars, while its market cap stands at around $58 billion. High liquidity typically reinforces the peg, as large traders can move in quickly to restore parity whenever USDC drifts too far from $1.00. In fact, these rapid rebalancing actions are partly why the 1-minute and 5-minute charts look so choppy.
Here is the only time we’ll use bullet points in this article:
- Support Range: Around $0.9990 to $0.9985
- Resistance Range: Around $1.0005 to $1.0010
Price occasionally tests these zones but consistently returns to the midpoint near $1.00.
Read More: Swing Trading vs. Scalping: Which Strategy Suits You Best?
Future Price Projections
From a purely technical standpoint, the odds favor continued stability. The following scenarios, based on the recent charts, cover the short to medium term:
Short-Term (Hours to Days):
Expect more oscillations within a very tight band of $0.9990 to $1.0010. With the 9-period SMA and EMA nearly overlapping at $1.0002, it is unlikely USDC will break out of this micro-range unless a catalyst—such as a liquidity crunch or a sudden spike in redemption—triggers abnormal volatility.
Medium-Term (Weeks to Months):
Given the historically consistent peg, USDC may see brief deviations if market sentiment around stablecoins shifts or if trading volume surges on major exchanges. Even then, these swings typically self-correct within hours. Technically, a slight dip toward $0.998 could occur, but any extended movement below that level is historically rare and would likely be met by strong buying pressure to restore parity.
Long-Term Outlook:
USDC’s structure and widespread usage across crypto markets hint at a high probability of the coin staying pegged close to $1.00. While no stablecoin is immune to broader market shocks, the charts and volume data suggest USDC’s well-established stability is set to continue. Traders should still watch volume spikes and outlier events, but the baseline expectation is for USDC to remain near the $1.00 mark.
In summary, technical indicators show that USDC is remarkably steady, confined to a narrow trading channel just above and below $1.00. Unless a major shift in market sentiment arises, we can anticipate USDC’s price to hover comfortably between $0.999 and $1.001, with short-lived ventures slightly beyond those levels. For day traders, the opportunities are minimal unless they are arbitraging fractions of a cent. For most investors, USDC remains a relatively safe harbor that fulfills its primary function: maintaining parity with the U.S. dollar.