
The Graph (GRT) has caught the eye of crypto traders once again, hovering near the psychologically important $0.09 zone. With its market cap recently dipping below $900 million, many are wondering whether GRT will defend current support levels or head toward new lows. In this article, we’ll examine GRT’s charts from multiple timeframes, analyze key technical indicators, and outline what traders might expect in the near future.
Read More:The Best Crypto Indicators for Long-Term Investing
1. Current Market Overview
After touching highs above $0.35 in December, GRT has undergone a pronounced downtrend that continues to pressure the token’s price. Recent charts show a steady decline from the $0.10–$0.12 region, with bears mostly in control of the market. On shorter timeframes, such as the 1-minute or 5-minute charts, GRT has tried to stage brief recoveries above $0.095 but has struggled to maintain momentum. Meanwhile, the higher-timeframe (2-hour) chart reveals a consistent downtrend that has accelerated from mid-February into March, pulling the price into the $0.08–$0.09 corridor.
Trading volume has risen in the last 24 hours—surpassing $58 million—but that increase in volume has yet to translate into sustained upward pressure. GRT’s market capitalization, now around $864 million, reflects the pullback’s severity compared to its peaks several months ago. Sentiment appears cautious, as buyers wait to see if GRT will stabilize around $0.09 or continue sliding toward the lower $0.08 region.
Despite this cautious climate, GRT remains one of the more actively traded tokens in the indexing sector. Traders are closely watching support levels, as well as volatility spikes that could hint at a turnaround. Until there is a clear change in direction, the overall landscape suggests a bearish tilt.
2. Technical Analysis & Trend
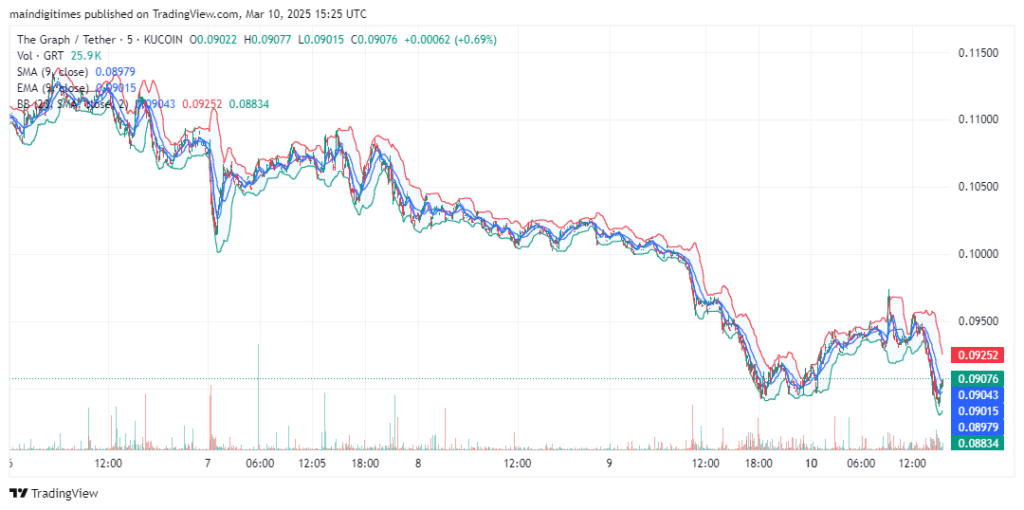
A closer look at the provided technical indicators helps clarify GRT’s short-term and medium-term posture:
- Moving Averages: On the 2-hour chart, both the 9-period Simple Moving Average (SMA) and the 9-period Exponential Moving Average (EMA) have been trending above the current price. This indicates a lack of bullish momentum, as GRT continues to trade beneath these important dynamic resistance lines. When price sits below these moving averages, it often signals an ongoing downtrend.
- Bollinger Bands: GRT has been flirting with the lower band on the 2-hour timeframe (shown around $0.088–$0.09). While tagging the lower band can sometimes hint at oversold conditions, it can also denote sustained selling pressure if the price continually rides the lower boundary.
- Support & Resistance Zones:
- Immediate Support: Around $0.088–$0.09, where the lower Bollinger Band and recent price floors converge.
- Secondary Support: Near $0.085, based on previous swing lows visible on intraday charts. A break below $0.085 could open a path toward $0.08 or lower.
- Resistance Levels: $0.095 has emerged as a short-term barrier, and $0.10 remains key psychological and technical resistance. Sustaining trades above $0.10 could invigorate bullish sentiment.
The current evidence weighs more on the bearish side, given the downward slope of the moving averages and GRT’s difficulty in breaking back above $0.095. However, the daily trading volume uptick suggests that volatility could be on the horizon.
Read More: Swing Trading vs. Scalping: Which Strategy Suits You Best?
3. Price Outlook and Targets
With multiple indicators aligning to show a continued bearish bias, a move below $0.09 remains a distinct possibility. Barring a sudden influx of bullish volume, GRT is at risk of testing support closer to $0.085. A decisive breakdown of that zone could extend losses toward $0.08. Still, it’s crucial to emphasize that the crypto markets can change quickly, and any shift in overall market sentiment—or a larger altcoin rally—could spark rapid upside for GRT.
Below is the only set of bullet points we’ll use to summarize potential scenarios:
- Bearish Scenario: If GRT fails to hold above $0.088–$0.09, look for a drop toward $0.085, with potential further downside to $0.08 if selling accelerates.
- Bullish Reversal: A surge in buying volume propelling GRT above the 9-day SMA and EMA (near $0.095–$0.10) would be an early signal of recovery. This could pave the way for a run to $0.12 should momentum sustain.
Considering the momentum-driven nature of crypto assets, even a small catalyst—like a surge in overall market sentiment—can break bearish patterns and trigger a reversal. For longer-term traders, the key may be waiting for confirmation above key moving averages. For shorter-term speculators, closely tracking support breaks and volume spikes will likely guide more tactical entries and exits.
In summary, The Graph’s technical picture shows a market still trending lower, but not devoid of reversal potential. The token’s immediate challenge lies in defending $0.09 and gathering enough bullish pressure to breach overhead resistance at $0.095–$0.10. Should GRT remain below its moving averages, the odds of a deeper slide toward $0.08 rise significantly. Conversely, if increased buying pressure pushes GRT over $0.10, there is room for a meaningful bounce, possibly extending to $0.12. As with any crypto asset, prudent risk management remains paramount, and traders should keep a close eye on volume trends and key support-resistance levels to inform their next moves.