
Supra has recently caught traders’ attention after a notable dip from the $0.011 region down to around $0.010. With many market participants eager for clues on whether a bounce is imminent or if further downside is in store, the latest charts show plenty of signals worth dissecting. Below, we delve into the key technical factors shaping Supra’s trajectory and map out potential price targets to watch.
Read More: The Best Crypto Indicators for Long-Term Investing
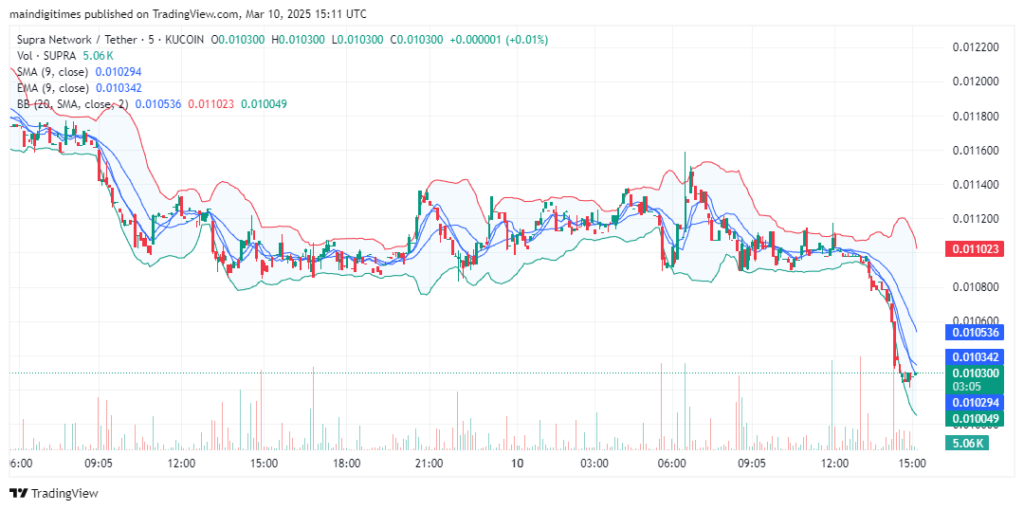
Current Market Status: Short-Term Bearish Pressures
Looking at Supra’s recent price action, the token has moved into a short-term bearish phase. Evidence for this can be found on both the 1-minute and 5-minute charts provided. The price is currently trading beneath its 9-day Simple Moving Average (SMA) and 9-day Exponential Moving Average (EMA), both hovering around the $0.0103 level at the time of writing. This positioning indicates that sellers hold the upper hand in the near term.
Another sign of bearish momentum is the pronounced downward slope in the Bollinger Bands, which have widened considerably during the latest sell-off. Widening bands often suggest rising volatility, and in Supra’s case, this heightened volatility has been accompanied by downward price pressure. Moreover, if you look at the 24-hour volume—which hovers around $18 million, nearly 19% of the market cap—there appears to be sufficient trading activity to sustain either a breakout or continued slide, depending on broader market sentiment.
On the larger 2-hour chart, Supra has seen an extended downtrend from its December peak near $0.08 to the current $0.01 range, demonstrating that the bears have controlled the macro picture for several months. Despite brief rallies, the token has consistently set lower highs, confirming a broader downward path that will need a stronger catalyst to break.
Technical Indicators: Gauging Momentum and Levels
Although the RSI (Relative Strength Index) is not displayed in the provided screenshots, the evident price decline under key moving averages implies that Supra could be nearing oversold territory in the short run. Still, it would be premature to call for a strong reversal solely on that basis. A confluence of additional indicators—such as a bullish divergence in RSI or a sharp spike in volume—would strengthen the case for a bounce.
The 9-day and 9-week MAs tell a similar story: Supra’s price has consistently stayed below its short- to medium-term moving averages, reinforcing the downward bias. If the token fails to reclaim these moving averages in the coming days, traders could see more selling pressure.
Meanwhile, the Bollinger Bands on the 2-hour and 4-hour timeframes suggest periods of high volatility, which often precede pivotal moves. As the price hugs the lower band, a bounce could occur if buyers step in to defend key support, or the token could slip further if market sentiment remains negative.
Here is the only bullet list for clarity:
- Immediate Support: $0.010
- Secondary Support: $0.009
- First Resistance: $0.011
- Key Resistance Above: $0.012
The $0.010 mark is a psychological level that could trigger a wave of buying if traders perceive it as a bargain entry. However, a decisive close below $0.009 might signal an even steeper descent.
Read More: Swing Trading vs. Scalping: Which Strategy Suits You Best?
Looking Ahead: Potential Outcomes and Targets
Given the technical evidence, two main scenarios emerge.
Bearish Continuation:
If Supra remains below its 9-day SMA and continues failing to hold above $0.010, it could revisit or even breach the $0.009 level. Such a drop would likely require broader market weakness or a lack of bullish catalysts specific to Supra. In this case, traders would be wise to monitor volume closely; shrinking volume during a downturn might confirm waning interest and pave the way to lower lows.
Bullish Reversal:
On the flip side, a solid close above both the 9-day and 9-week EMAs—coupled with a surge in buying volume—could spark a relief rally. This rally would first target resistance around $0.011, with a successful push higher potentially putting the $0.012 mark into play. A break and hold above $0.012, especially if accompanied by increased trading activity, would be an early sign that Supra might be staging a more enduring recovery.
Overall, Supra’s trend appears to lean bearish in the short term, but the token’s ability to hold the $0.010 line will be a critical factor in shaping its immediate outlook. Keep an eye on volatility spikes, moving average crossovers, and potential momentum divergences before making any trading decisions. Staying disciplined—by setting stop losses and using technical tools to confirm entry and exit points—can help navigate the swings that tend to characterize cryptocurrency markets.
In conclusion, while Supra’s near-term direction skews downward, the decisive point will likely hinge on whether it can stabilize above $0.010 or not. Traders and investors alike should remain watchful for any shifts in volume and volatility that could foreshadow either an impending breakdown or a relief bounce back toward $0.011 and beyond.