The Pi Network (PI) has recently demonstrated significant bullish momentum, with prices climbing over 45% in the past 24 hours to reach $0.9603.
The surge comes amid growing market interest, positioning PI as one of the standout performers in the crypto market.
While the uptrend appears strong, a technical analysis using Fibonacci retracement levels, moving averages, and Bollinger Bands offers insights into whether the current rally is sustainable.
Read More: Crypto Trading Hours: When to Buy and Sell for Maximum Profit?
PI Coin Price Movement and Trend
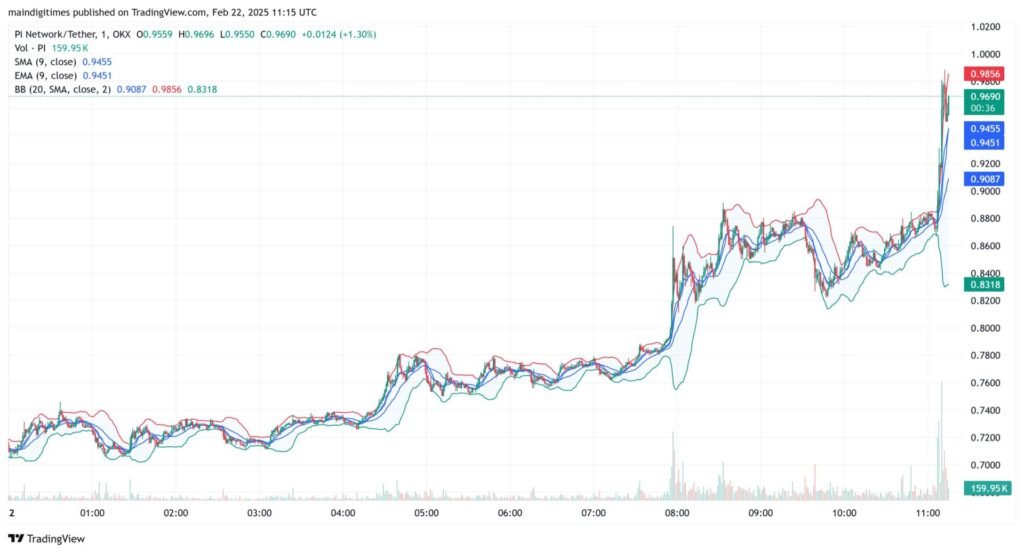
Over the past day, PI experienced a notable rally, moving from a low of $0.6609 to a daily high of $0.9883.
The sharp upward movement signifies strong buyer interest. Despite this, the 24-hour trading volume stands at $435.41 million, down 51.30%, suggesting some market caution despite the price surge.
Moving Averages (MA & EMA):
- On the 30-minute chart, the Simple Moving Average (SMA-9) sits at $0.8611, and the Exponential Moving Average (EMA-9) at $0.8649, both below the current price, confirming bullish sentiment.
- On the 5-minute timeframe, the SMA and EMA show similar trends with readings of $0.8965 and $0.9080 respectively, indicating sustained short-term buying pressure.
- On the 1-minute chart, the SMA and EMA converge at around $0.9455, providing immediate support just below the current price of $0.9690.
Fibonacci Retracement Levels:
Applying Fibonacci retracement from the swing high of $0.9883 to the low of $0.6609 identifies key support and resistance levels:
- 23.6% retracement: ~$0.7520 (recently broken, turning into support)
- 38.2% retracement: ~$0.8010
- 50% retracement: ~$0.8246 (held strong as a support level during minor pullbacks)
- 61.8% retracement: ~$0.8482 (recent breakout confirms bullish continuation)
PI trading above the 61.8% Fibonacci level indicates the potential for further gains, provided the price maintains this level as support.
Bollinger Bands Analysis:
Across all timeframes, the price has been hugging the upper Bollinger Band, indicating strong upward momentum. On the 1-minute and 5-minute charts, the upper bands extend beyond $0.98, suggesting potential near-term resistance. However, extended periods outside the bands could prompt a short-term correction.
Volume Analysis:
While overall 24-hour volume has decreased, intraday volume spikes align with significant upward price moves. This suggests that despite declining daily volume, buying pressure remains potent during critical price actions.
Market Sentiment: The broader sentiment around PI remains bullish, supported by technical indicators aligning with buyer dominance. However, traders should monitor volume trends and resistance zones to gauge potential reversals.
Price Projections
Bullish Scenario:
If PI sustains above $0.95, it could target immediate resistance at $0.9856. A breakout beyond this level could pave the way to test the psychological barrier at $1.00, with further extensions toward $1.05 and $1.10.
Bearish Scenario:
Failure to maintain support above $0.9450 could trigger a retracement to the $0.90 zone, with deeper pullbacks potentially revisiting the $0.85 and $0.80 Fibonacci levels.
Read More: What Is the Best Time to Trade Crypto?
Conclusion
Pi Network (PI) showcases strong bullish momentum, with technical indicators signaling continued upward pressure.
Trading above key moving averages and Fibonacci retracement levels suggests that bulls are in control. However, caution is advised as declining volume could lead to temporary corrections.
If PI breaks above $0.9856, it may enter price discovery mode, with targets beyond $1.00 within reach. Conversely, losing the $0.9450 support zone may invite short-term bearish pressure.
Traders should closely monitor volume and price action near these critical levels for confirmation of the next significant move.