The GBP/USD trading pair has seen moderate volatility in recent weeks, reflecting broader market trends influenced by economic data releases and central bank announcements. The pair’s performance has fluctuated due to contrasting economic indicators from both the UK and the US, as well as geopolitical factors impacting the global forex market. In this analysis, we will dissect the technical aspects of the GBP/USD pair using the 1-day, 5-day, and 6-month charts to provide a comprehensive outlook.
1-Day Chart Analysis

On the 1-day chart, the GBP/USD pair appears to be in a short-term downtrend. The price action shows a series of lower highs and lower lows, indicating bearish momentum. The 9-period Simple Moving Average (SMA) is currently at 1.34197, and the 9-period Exponential Moving Average (EMA) is slightly above at 1.34200, suggesting that the short-term moving average indicators are closely aligned, confirming the downward trend.
The Bollinger Bands (BB) are relatively wide, reflecting increased market volatility. The price is currently testing the lower band, which might indicate an oversold condition. The Relative Strength Index (RSI) stands at 40.42, hovering near the oversold territory, while the Moving Average Convergence Divergence (MACD) shows a bearish crossover, with the MACD line crossing below the signal line and histograms in negative territory. This convergence of bearish indicators suggests that the pair could continue to experience downward pressure in the short term.
Read More: HNT/USDT Technical Analysis: Key Levels and Trade Ideas – Sep 24
5-Day Chart Analysis

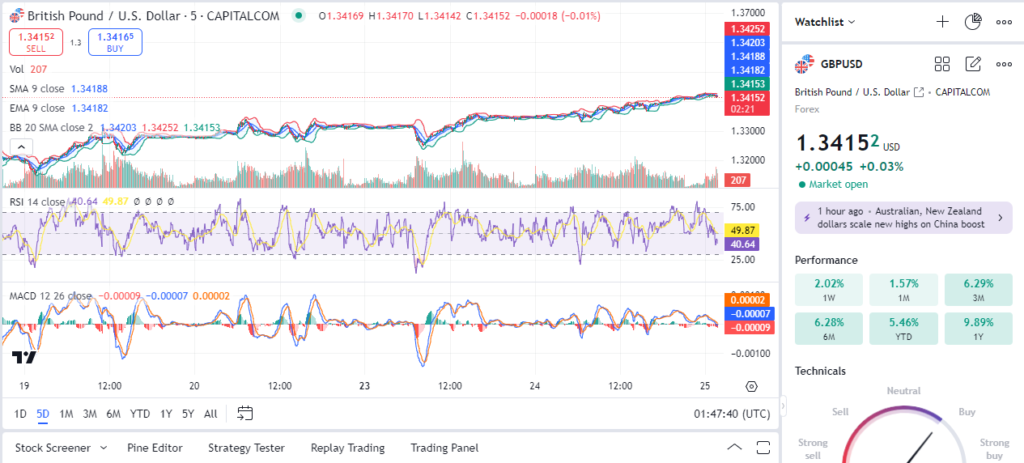
The 5-day chart presents a slightly different narrative, highlighting a consolidation phase following a brief bullish run. The SMA and EMA are almost identical, both positioned at 1.34188 and 1.34182, respectively. The close proximity of these moving averages signifies a lack of strong directional momentum. The Bollinger Bands have narrowed, suggesting a potential decrease in volatility and a possible squeeze in price action.
RSI on the 5-day chart is at 49.87, indicating a neutral stance, as the pair neither shows overbought nor oversold conditions. The MACD is also in a neutral position, with the MACD and signal lines overlapping and the histogram showing minimal divergence. This scenario typically precedes a breakout or breakdown, so traders should watch for a decisive move beyond the consolidation range of approximately 1.3410 to 1.3450.
6-Month Chart Analysis

The 6-month chart reveals a more bullish outlook for the GBP/USD pair. The pair has been in an uptrend since June, forming higher highs and higher lows, indicative of a strong bullish trend. The 9-period SMA and EMA are aligned at 1.34000, providing a strong support level. The Bollinger Bands are moderately wide, reflecting sustained volatility but also consistent upward price movement.
The RSI stands at 66.88, approaching the overbought territory but not yet signaling a reversal. The MACD on this longer-term chart shows a strong bullish signal, with the MACD line well above the signal line and positive histograms. This confluence of bullish indicators suggests that the pair could continue its upward trajectory, provided it maintains support above the 1.3400 level.
Read More: XRP/USDT Technical Analysis: Key Levels and Trade Ideas – Sep 24
Trade Ideas and Recommendations
Based on the technical analysis of the GBP/USD across different time frames, the following trade ideas are suggested:
1. Short-Term Trade:
- Entry Point: Consider entering a short position around 1.3420 if the price closes below the current level and confirms the bearish trend.
- Stop-Loss: Place a stop-loss above the recent high at 1.3450 to manage risk in case of a reversal.
- Take-Profit: Target the 1.3350 level, where previous support has been observed, aligning with the lower Bollinger Band.
2. Medium-Term Trade:
- Entry Point: A breakout strategy could be employed. Enter a long position if the price breaks above 1.3450 with strong volume, indicating a continuation of the uptrend.
- Stop-Loss: Set a stop-loss below 1.3400, ensuring protection against false breakouts.
- Take-Profit: Aim for 1.3500, aligning with the upper boundary of the recent consolidation range.
3. Long-Term Trade:
- Entry Point: A long position could be considered on a pullback towards the 1.3400 support level, taking advantage of the overall bullish trend.
- Stop-Loss: A conservative stop-loss can be placed below 1.3300, accommodating potential volatility while preserving the trade.
- Take-Profit: The long-term target would be around 1.3600, aligning with the projected resistance level based on previous highs.
Risk Management Tips
- Position Sizing: Use appropriate position sizing based on your risk tolerance and account size. Avoid risking more than 2-3% of your trading capital on a single trade.
- Monitor Economic Events: Keep an eye on upcoming economic events and news releases from both the UK and the US, as these can significantly impact the GBP/USD pair.
- Use Trailing Stops: Consider using trailing stops to lock in profits as the trade moves in your favor, especially in volatile market conditions.
- Diversify: Avoid overexposure to a single currency pair by diversifying your trades across different pairs or asset classes.
In conclusion, while the short-term outlook for GBP/USD suggests bearish momentum, the medium to long-term perspective indicates potential for a bullish continuation. Traders should employ a flexible strategy, adapting to market conditions as new data emerges.


