The British Pound/Canadian Dollar (GBP/CAD) pair has been climbing steadily, drawing attention from traders eager to capitalize on its rising momentum. Recent activity shows the pair breaking key resistance areas and hovering around the 1.8250 mark—raising the question: Is 1.83 the next immediate target, or could the pair surge even higher?
Below is a technical analysis of GBP/CAD based on the provided charts, focusing on short- to medium-term indicators that can help shape realistic price predictions. We will look at the current trend, evaluate key technical signals, and then map out probable short-term targets and support zones.
Read More: Weekend vs. Weekday Crypto Trading: Which Is More Profitable?
Understanding the Recent Uptrend
GBP/CAD has been on a notable upswing, as evident from the 1-minute, 5-minute, and 2-hour charts. A glance at the 2-hour timeframe reveals that, from mid-winter lows around 1.7500–1.7600, the pair has rallied well above 1.8200. Each retracement over the last few weeks was met with renewed buying pressure, underscoring strong bullish sentiment.
Several factors reinforce this trend. The higher lows and higher highs are visible on the intermediate (2-hour) chart, suggesting a continuing uptrend. Furthermore, candlestick patterns reveal a series of bullish closes that breach minor resistance levels—particularly around 1.8050 and 1.8150—where the market briefly hesitated before pushing upward again.
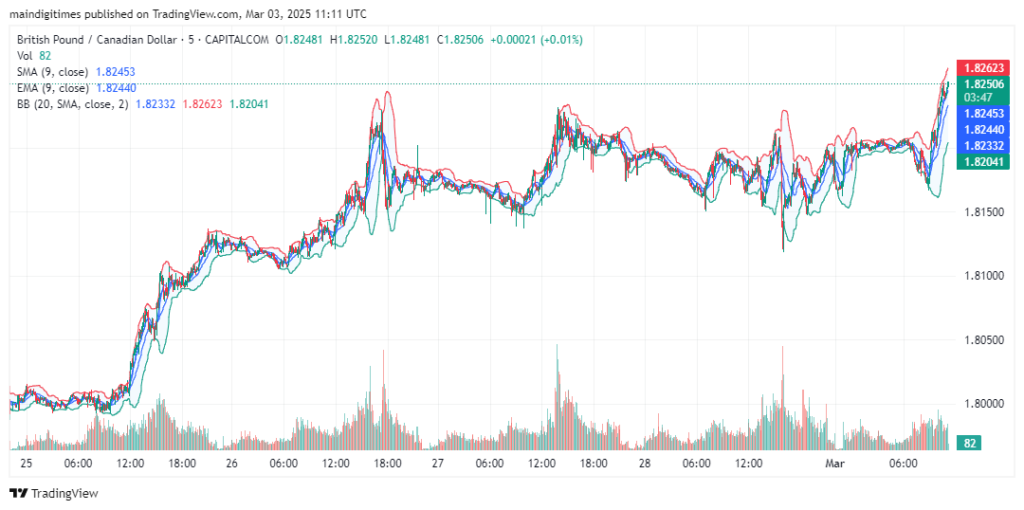
The price is currently trading near 1.8250, having bounced from intraday pullbacks in the 1.8150 region. The slope of this ascent, especially on the 5-minute chart, indicates sustained intraday momentum. Although small dips have appeared, buyers have been quick to re-enter, propping the pair higher.
Technical Indicators Supporting a Bullish Outlook
The provided screenshots include a few popular tools: the 9-period Simple Moving Average (SMA), the 9-period Exponential Moving Average (EMA), and Bollinger Bands (20,2). Even on the lower timeframes (1-minute and 5-minute charts), these indicators align with a bullish scenario.
- Moving Averages Alignment: With GBP/CAD consistently closing above both the 9-SMA and 9-EMA, short-term momentum remains firmly in the bulls’ control. The 9-EMA is often used as a “fast” indicator of trend, and its position below the current price reinforces the idea that buyers are in charge.
- Bollinger Bands: Prices have made several runs toward the upper Bollinger Band, signaling strong upward thrust. While this can sometimes hint at overextension, any pullback has so far been modest and short-lived, indicating that GBP/CAD still has upward room before a major correction becomes likely.
Here is one concise set of bullet points to summarize additional observations:
- Volume Upticks: Volume spikes coincide with bullish price moves, suggesting genuine buying interest.
- Price “Squeezes”: Periodic Bollinger Band contractions, followed by expansions, have typically resolved to the upside.
- Support Levels: The 1.8150 and 1.8050 zones served as strong intraday support levels in recent sessions.
On higher timeframes, the SMA and EMA continue to show an upward slope. Even with slight volatility, the trend channel is skewed in favor of more gains ahead.
Short-Term Price Targets and Potential Pullbacks
Assuming the current momentum continues, the next near-term target appears to be 1.8300–1.8350. This region aligns with prior swing highs on the 2-hour chart and could act as a psychological barrier. If bullish momentum remains robust, a convincing break above 1.8350 could expose the pair to a further rally toward 1.8400 or possibly even higher levels if positive sentiment persists.
That said, pullbacks are inevitable in any trending market. A correction to the 1.8150 or even 1.8050 area is conceivable, especially if profit-taking sets in or if external fundamentals (such as oil price movements affecting the Canadian Dollar) trigger a short-term bounce for CAD. However, given the current alignment of moving averages and how sharply GBP/CAD has rebounded from recent lows, any retracement may be brief unless unexpected macroeconomic news turns sentiment around.
Traders should keep an eye on the Bollinger Bands, as a widening band with price hugging the upper edge often suggests strong momentum but also the potential for quick reversals if the market becomes overbought. In addition, continued closes above the 9-EMA on the 1-hour or 2-hour charts can serve as confirmation that bulls remain firmly in the driver’s seat.
Read More: Crypto Trading Hours: When to Buy and Sell for Maximum Profit?
In conclusion, the GBP/CAD pair is currently in a well-defined uptrend, supported by ascending moving averages and bullish Bollinger Band patterns across multiple timeframes. With 1.8250 now acting as a springboard, the next test near 1.8300–1.8350 seems likely. While caution is always advised—especially given the potential for short-term retracements—the technical evidence points to a strong bullish phase. A break above the mid-1.83 region could open the path toward 1.84 and beyond, while any dips toward the 1.81 handle are likely to attract value-seeking buyers.