The EUR/JPY trading pair has recently displayed mixed performance amid fluctuating market conditions, marked by a shift in risk sentiment and evolving macroeconomic factors. Over the past six months, the pair has encountered periods of both bullish and bearish momentum, leading to notable shifts in its price trends. This article breaks down the EUR/JPY’s recent performance using 1-day, 5-day, and 6-month charts to offer a comprehensive technical analysis and actionable trade ideas.
1-Day Chart Analysis

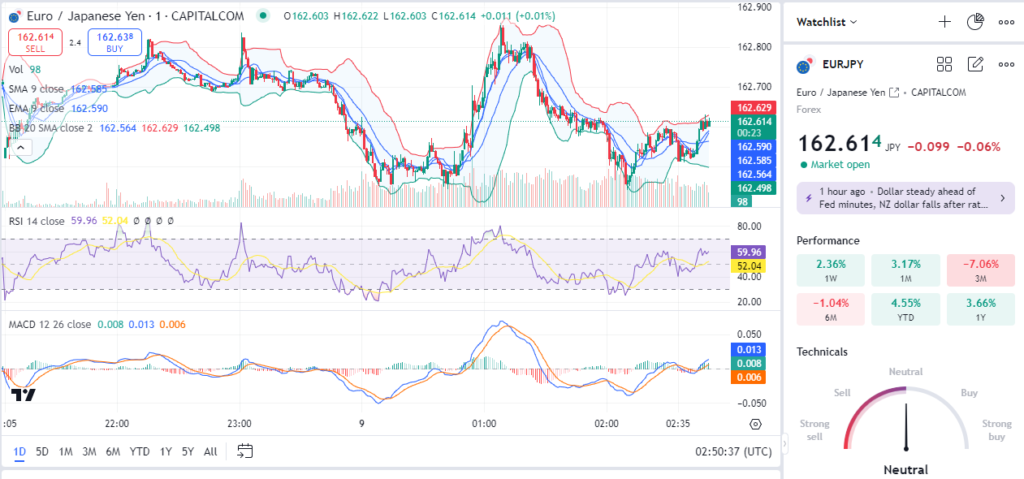
In the 1-day chart, EUR/JPY exhibits short-term price volatility, as evidenced by oscillating movements around the 162.6 level. The chart shows the presence of key technical indicators like the Simple Moving Average (SMA), Exponential Moving Average (EMA), and Bollinger Bands, which offer insights into the pair’s recent behavior. The 9-period SMA and EMA, closely aligned near 162.58, act as dynamic support and resistance levels, highlighting consolidation in price action.
The RSI (14) value of approximately 59.96 suggests that the market is neither overbought nor oversold, hinting at a neutral stance with a slight upward bias. Meanwhile, the MACD indicator remains close to the zero line, indicating limited momentum in either direction. The Bollinger Bands display a moderate contraction, pointing to a possible decrease in volatility in the short term. Overall, the 1-day chart signals a period of indecisiveness in the EUR/JPY market, with no clear directional trend emerging.
Read More: USD/JPY Technical Price Analysis: An In-Depth Look at Recent Trends and Trade Opportunities – Oct 8
5-Day Chart Analysis

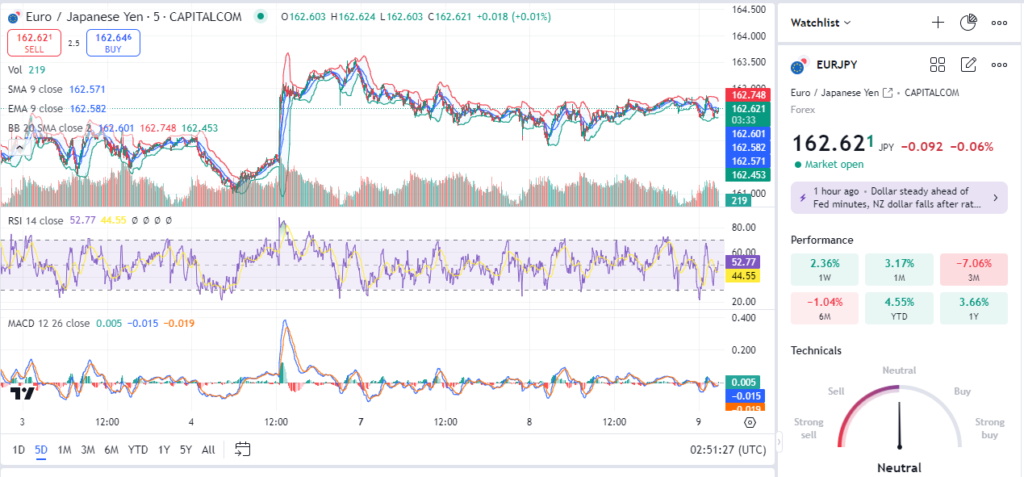
On the 5-day chart, EUR/JPY’s price action shows a more pronounced sideways movement around the 162.6 level. This timeframe highlights the market’s attempts to break out of a narrow range, with resistance near 162.74 and support around 162.45. The SMA and EMA (9-period) remain closely clustered, indicating a lack of strong directional bias over the medium term.
The RSI (14) on this chart stands at 52.77, reinforcing a neutral sentiment as the pair hovers in the middle of the typical range between 30 and 70. The MACD histogram reveals slight divergences, but no significant bullish or bearish crossovers, which suggests that traders are waiting for a clearer trend to form. The narrow Bollinger Bands indicate reduced volatility, hinting that a breakout or breakdown could be on the horizon once volatility picks up again. Overall, the 5-day chart analysis suggests a wait-and-watch approach as the EUR/JPY remains range-bound.
6-Month Chart Analysis

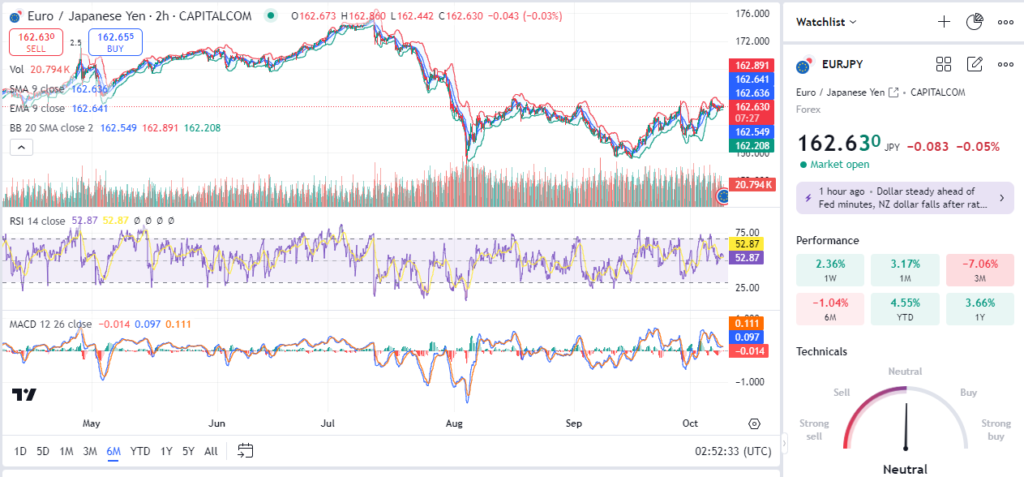
Examining the 6-month chart of EUR/JPY provides a broader view of the pair’s longer-term trends and price movements. The chart reveals that the pair experienced a steep decline earlier, followed by a gradual recovery towards the 162.6 area. The SMA and EMA lines on this chart indicate a downtrend that seems to be stabilizing as prices have found support near the 162.20-162.30 zone.
The RSI (14) value of 52.87 reflects a neutral stance, suggesting that the recovery has not yet tipped into an overbought territory. The MACD, with a slight positive divergence, points to diminishing bearish momentum, indicating a potential trend reversal or at least a period of consolidation around current levels. The Bollinger Bands remain relatively wide, implying that the market could see increased price swings in the coming weeks as traders react to broader economic trends.
Overall, the 6-month chart suggests that EUR/JPY could be at a turning point, with the potential for either a continuation of its recovery phase or a retracement if bearish pressures re-emerge.
Read More: EUR/GBP Technical Analysis: Key Levels and Trade Ideas – Oct 8
Trade Ideas for EUR/JPY
Given the mixed technical signals across different timeframes, traders can consider the following trade ideas for EUR/JPY, based on their risk tolerance and preferred trading horizon:
- Short-term Buy Opportunity:
- Entry Point: Consider entering a long position if EUR/JPY breaks above the 162.75 resistance level on the 1-day chart, indicating a potential breakout.
- Target: Set a profit target at 163.50, which aligns with the upper Bollinger Band, representing the next potential resistance zone.
- Stop-Loss: Place a stop-loss at 162.20, below the recent support, to minimize risk in case of a sudden reversal.
- Risk Management: Risk no more than 2% of trading capital on this position, ensuring that the potential loss is manageable.
- Medium-term Range Trading:
- Strategy: With the 5-day chart indicating range-bound conditions, traders can capitalize on price swings between 162.45 and 162.74.
- Entry Points: Look to buy near the 162.45 support level and sell around 162.74 resistance.
- Stop-Loss: Place a tight stop-loss of around 20 pips below entry levels to manage downside risk.
- Target: Aim for a profit target of 20-30 pips per trade, taking advantage of the tight range for quick gains.
- Long-term Buy on Dips:
- Entry Point: For traders with a longer horizon, consider buying on dips towards the 162.20 level, as suggested by the 6-month support zone.
- Target: Set a target of 164.00, anticipating a gradual recovery towards previous highs if bullish momentum builds.
- Stop-Loss: Place a stop-loss below 161.80 to protect against a deeper retracement.
- Risk Management: Use a position size that reflects a long-term outlook, risking only 1-2% of capital to account for potential volatility in the broader market.
Risk Management Tips
- Diversify Positions: Avoid over-leveraging on a single currency pair, especially in volatile markets like EUR/JPY. Consider balancing exposure with other pairs or asset classes.
- Adjust Stops: Adjust stop-loss levels to break-even or better once a trade moves in the desired direction, ensuring that profits are locked in.
- Monitor Macroeconomic Events: Keep an eye on events like central bank announcements and economic data releases, as these can significantly impact the EUR/JPY pair’s direction.
- Use Trailing Stops for Long-term Trades: For longer-term positions, consider using trailing stops to capture potential upside while protecting gains as the market moves.
Conclusion
The EUR/JPY pair currently displays a mixed technical picture, with varying signals across different timeframes. Short-term traders may find opportunities in potential breakouts or range-bound conditions, while long-term investors could benefit from a buy-on-dip strategy, anticipating a recovery. As always, effective risk management remains key to navigating this dynamic market, and traders should remain vigilant to shifts in market sentiment and broader economic trends.


