
The EUR/AUD pair has shown significant bullish momentum in recent sessions, climbing steadily before encountering resistance. Traders are closely watching whether the pair will continue its upward trend or face a potential pullback. By analyzing short, medium, and long-term price movements, we can gauge the strength of the trend and identify possible future price movements.
Trend Overview
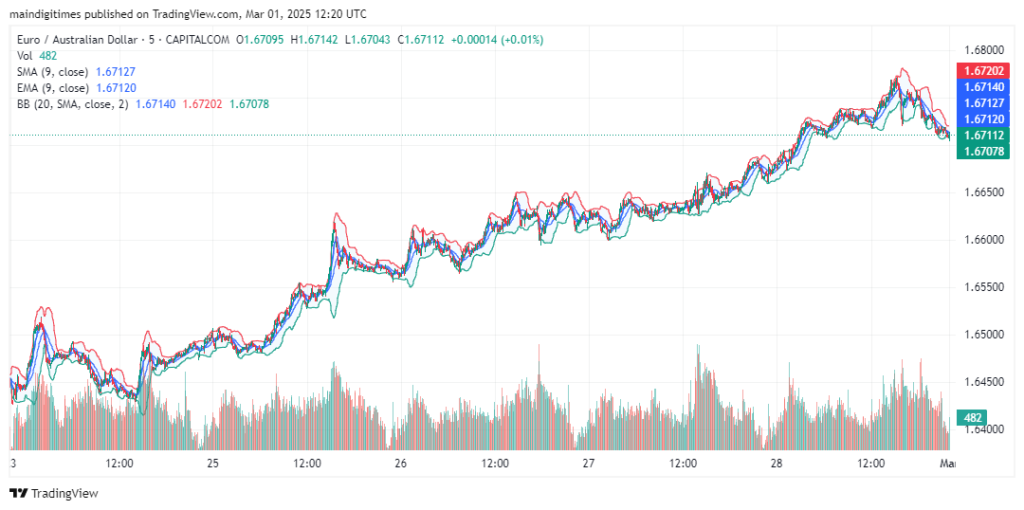
The short-term price action suggests slight consolidation after a strong uptrend, indicating that EUR/AUD may be facing a resistance level. Meanwhile, the 2-hour chart provides a broader perspective, showing a well-defined bullish structure with pullbacks creating higher lows—typically a sign of a sustained uptrend.
Read More: Crypto Trading Hours: When to Buy and Sell for Maximum Profit?
Technical Indicators & Key Levels
- Simple Moving Average (SMA – 9 period): Across all charts, the SMA aligns closely with price action, signaling strong momentum.
- Exponential Moving Average (EMA – 9 period): The EMA remains below the price, acting as dynamic support—further reinforcing bullish sentiment.
- Bollinger Bands (BB – 20 period, SMA, 2 standard deviations):
- Price is currently near the upper Bollinger Band, which could indicate overbought conditions in the short term.
- Any breakout above the band may signal further continuation, while rejection could trigger a minor pullback.
Short-Term Price Movement
- Price rallied steadily but is now showing signs of slowing down near 1.6720 – 1.6730.
- Volume remains moderate, which may indicate hesitation among traders at current levels.
- The short-term outlook suggests either consolidation or a mild correction before the next move.
Mid-Term & Long-Term Trends
- Higher highs and higher lows suggest that EUR/AUD remains in an uptrend on a larger scale.
- The 1.6690 region (Bollinger Band mid-line) is acting as support, reinforcing buyers’ confidence.
- Resistance is forming around 1.6770 – 1.6800, which aligns with historical rejection zones.
- If buyers break above 1.6800, we could see further upside toward 1.6900.
Projection & Trade Considerations
- Bullish case: If EUR/AUD holds above 1.6690 – 1.6710, we may see another leg up toward 1.6800, with potential to test 1.6900 in the coming sessions.
- Bearish case: A drop below 1.6690 could open the door for a retracement to 1.6600, where buyers may re-enter.
- Watch for volume spikes—a strong breakout on increased volume would confirm the next move.
Read More: What Is the Best Time to Trade Crypto?
Conclusion
The bullish trend remains intact, but the EUR/AUD pair is approaching key resistance. A decisive break above 1.6800 would reinforce upward momentum, while failure to breach resistance could trigger short-term corrections. Traders should monitor support levels and volume for confirmation of the next direction.