
Ethereum (ETH) has been stuck in a downward consolidation, struggling to break past crucial resistance levels as bearish momentum continues to weigh on its price.
Currently trading at $2,669, ETH has failed to reclaim the $2,710 resistance level, signaling that buying pressure remains weak. Technical indicators such as Fibonacci retracement, moving averages, and RSI paint a picture of uncertainty, leaving traders wondering: Is ETH gearing up for a recovery, or is another drop on the horizon?
Ethereum’s Current Price Structure: Bearish Under Key Levels
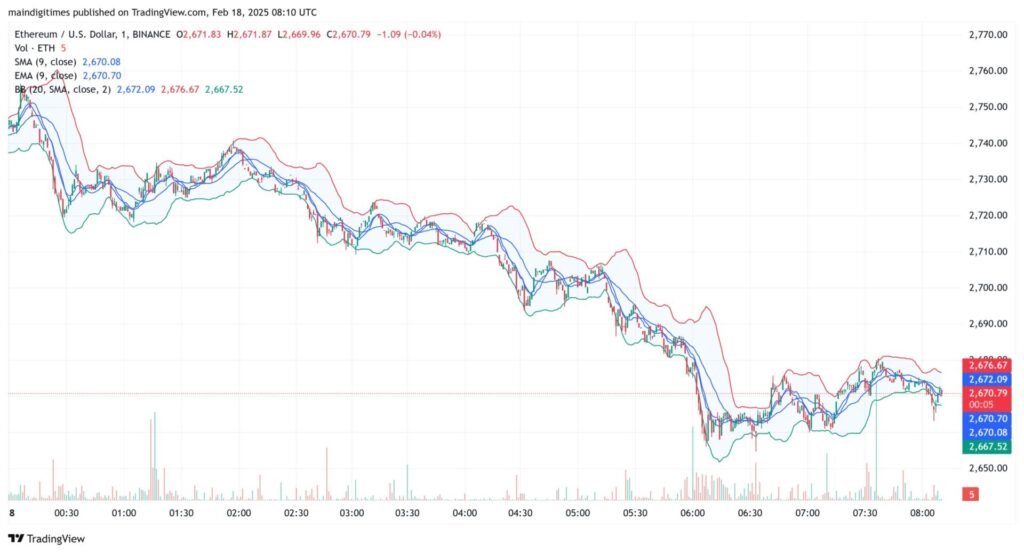
A closer look at Ethereum’s 2-hour and 5-minute charts reveals a persistent struggle to maintain support levels. The Simple Moving Average (SMA) and Exponential Moving Average (EMA) both show that ETH remains below short-term trend indicators, confirming the presence of bearish pressure.
The 9-period SMA is positioned at $2,716, while the 9-period EMA sits at $2,704, both slightly above ETH’s current price, acting as resistance.
Meanwhile, Bollinger Bands indicate ongoing volatility, with ETH trading closer to the lower band at $2,635, suggesting that downside risks still exist. Unless a strong volume spike propels ETH beyond these moving averages, the market remains vulnerable to further declines.
Fibonacci Retracement Shows Strong Resistance Zones
Fibonacci retracement levels offer key insights into Ethereum’s potential recovery or further downside movement. Measuring from ETH’s recent swing high above $3,800 to its current swing low near $2,600, we find clear resistance barriers:
- 23.6% Fibonacci Retracement: $2,910
- 38.2% Fibonacci Retracement: $3,120
- 50.0% Fibonacci Retracement: $3,230
ETH’s failure to break above the $2,910 level (23.6% retracement) suggests that the current trend is still bearish. A successful move past this level could trigger a short-term rally, but without a strong catalyst, ETH remains vulnerable to further downside pressure.
Read Now: What Is the Best Time to Trade Crypto?
RSI Indicator: No Strong Buying Pressure Yet
The Relative Strength Index (RSI) on lower timeframes remains stuck in the 40-50 range, indicating neutral to bearish momentum. Typically, an RSI above 70 signals an overbought market, while an RSI below 30 suggests an oversold condition. Since ETH’s RSI hasn’t reached oversold levels yet, a stronger correction could be needed before a true reversal occurs.
Will Ethereum Drop Below $2,600 or Rally Past $2,910?
Ethereum is currently at a make-or-break point. If selling pressure intensifies and ETH fails to hold $2,635, it could retest $2,600 or even lower support levels. However, if buyers step in and push ETH beyond $2,710, a move toward the $2,910 Fibonacci resistance level could be in play.
A breakout past $3,120 would indicate a more sustained bullish recovery, but given the current lack of buying momentum, ETH remains at risk of continued downside.
Conclusion: Caution Ahead for ETH Traders
Ethereum’s price action remains indecisive, with bearish pressure keeping it below key resistance levels. The $2,635 support level is crucial, as a break below this could lead to further declines toward $2,500.
On the other hand, a breakout past $2,710 and eventually $2,910 would signal a shift in momentum, potentially leading ETH back into a bullish trajectory. Until then, traders should remain cautious, keeping an eye on volume and market sentiment before making high-risk moves.
Read More: Bitcoin, Ethereum, and Solana Struggle to Find Direction – Is a Breakout on the Horizon?