
Are you watching the ELIXIR (ELX) charts and wondering where this token might be headed next? Recent volatility has captured traders’ attention, with prices hovering around the $0.008 mark on CoinEx—and a much higher valuation shown on some aggregators. Below, we’ll dissect the technicals from multiple timeframes to help clarify the outlook and map out where ELIXIR could go in both the short and long term.
Read More: The Best Crypto Indicators for Long-Term Investing
Current Price Analysis: Is ELIXIR Bearish or Bullish?
After a series of dramatic peaks late last year—when ELIXIR briefly spiked well above $0.09—the market has retraced considerably. On the two-hour chart provided, the price has fallen into the sub-$0.01 range, reflecting a prolonged downtrend since January. While recent candles indicate there has been some stabilization around $0.008, the lower highs across February and early March suggest the overall trend remains tilted to the bearish side.
On shorter timeframes (such as the 1-minute and 5-minute charts), the token has shown brief pops toward $0.0082 and even $0.0085, yet these attempts have been quickly sold down. This price action underscores a market that is struggling to sustain rallies—often a sign that bears maintain the upper hand, at least until a higher low or strong support zone emerges.
Meanwhile, the discrepancy seen on sites like CoinGecko (where ELIX is shown trading around $0.50) may be due to different listings or token pairs. What’s clear from the charts, however, is that ELIXIR on CoinEx is tracking a narrow range near $0.008—so for technical analysis, these charts point to a cautious outlook unless key resistances are broken.
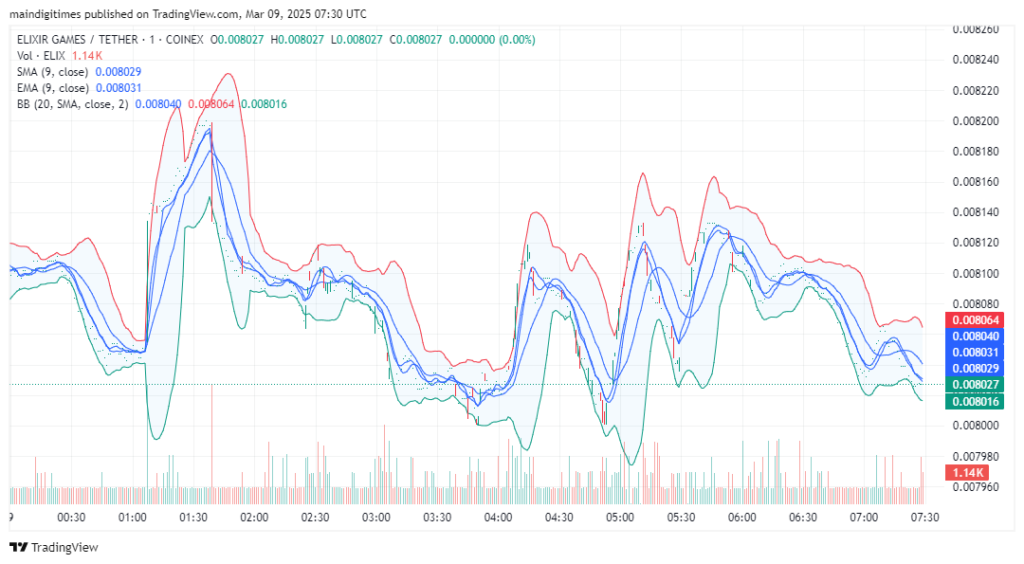
Technical Indicators and Key Support/Resistance Levels
Even with recent consolidation, several indicators lean slightly bearish:
- Moving Averages: On the short-term charts (1-minute and 5-minute), both the 9-period Simple Moving Average (SMA) and the 9-period Exponential Moving Average (EMA) hover right near the price, suggesting a tug-of-war with no decisive push higher. On the longer-term 2-hour chart, the price sits well below any longer moving averages from the past few months, reflecting the overarching downtrend.
- Bollinger Bands: The Bollinger Bands have narrowed on the lower timeframes, indicating reduced volatility. A breakout beyond the upper band around $0.0082 could spark short-term bullish momentum. Conversely, drifting below the lower band near $0.0078 might accelerate selling pressure.
- Volume Trends: The trade volume has come down significantly since late 2024, although occasional spikes hint at opportunistic buying near the $0.008 mark. Without a sustained rise in volume, however, any upswings are at risk of faltering quickly.
Below is the only brief bullet list we’ll use:
- Immediate Resistance: $0.0082–$0.0085
- Key Support: $0.0078–$0.0075
- Psychological Barrier: $0.01
A push above $0.0082 (and eventually $0.0085) could open a path toward the psychological $0.01 region. Failing that, any close below $0.0078 may see traders eyeing $0.0070 next.
Read More: Swing Trading vs. Scalping: Which Strategy Suits You Best?
Short- and Long-Term ELIXIR Price Projections
In the short term, ELIXIR seems locked in a narrow band between $0.0078 support and $0.0085 resistance. Barring a surge in demand, expect range-bound trading—oscillating in small intraday moves—until a catalyst arrives. That catalyst could be a higher low forming above $0.008, accompanied by a decisive volume uptick. If buyers gain confidence, the token might test $0.009–$0.01 again, especially if broader crypto sentiment improves.
Over the longer term, the 2-hour chart reveals a sharp downtrend stretching back to the massive December spike. It will likely take sustained market-wide bullishness or notable project developments for ELIXIR to revisit the highs above $0.03, let alone the extreme peaks near $0.09. Watch for a base-building phase—if ELIXIR holds firmly above $0.0075 in the weeks ahead and starts printing higher lows, that could mark the beginnings of a trend shift. From there, climbing above $0.01 and turning it into support would be a significant psychological milestone, potentially drawing sidelined investors back into the market.
In summary, ELIXIR still appears in a primarily bearish posture, with short-term fluctuations around $0.008. A close above $0.0085 on convincing volume might spark a modest rally, but until the token carves out a meaningful higher low and breaks established resistance, caution is advisable. As ever in crypto trading, monitoring broader market sentiment—especially Bitcoin and Ethereum—can offer clues to whether smaller tokens like ELIXIR might enjoy bullish tailwinds. Keep a close eye on those critical $0.0075 and $0.0085 levels in the days to come.