Chainlink (LINK) has recently been volatile, reflecting the broader trends within the cryptocurrency market.
In this analysis, we will delve into LINK’s price action over the past day, past 5 days, and the past 6 months, using technical indicators to provide insights into potential trading opportunities.
Additionally, we’ll explore both the bullish and bearish scenarios for LINK and offer trade ideas based on the technical outlook.
Daily Price Analysis (1-Day Chart)

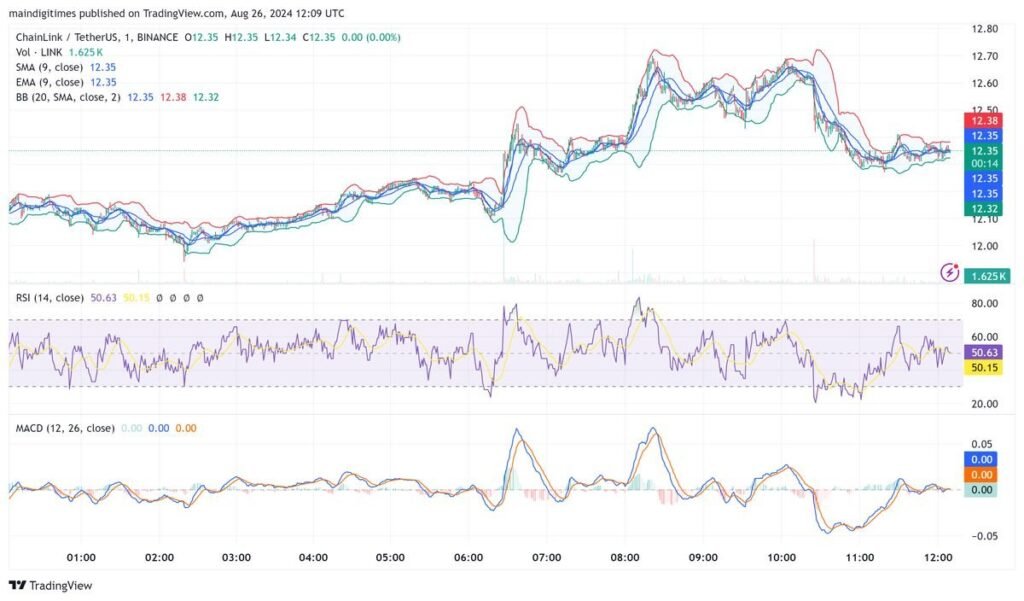
Looking at the 1-day chart, LINK has been trading within a narrow range, oscillating between $12.35 and $12.37.
The Bollinger Bands, a key indicator of volatility, show that the price is tightly compressed, which typically precedes a breakout.
The RSI (Relative Strength Index) is at 60.09, suggesting that LINK is slightly overbought but not at extreme levels.
The MACD (Moving Average Convergence Divergence) shows a potential bullish crossover, which could indicate an upward movement.
The combination of these indicators suggests that LINK might be gearing up for a breakout.
The key levels to watch are the $12.37 resistance and the $12.35 support. A break above or below these levels could provide a clear direction for the next move.
5-Day Price Analysis (5-Minute Chart)

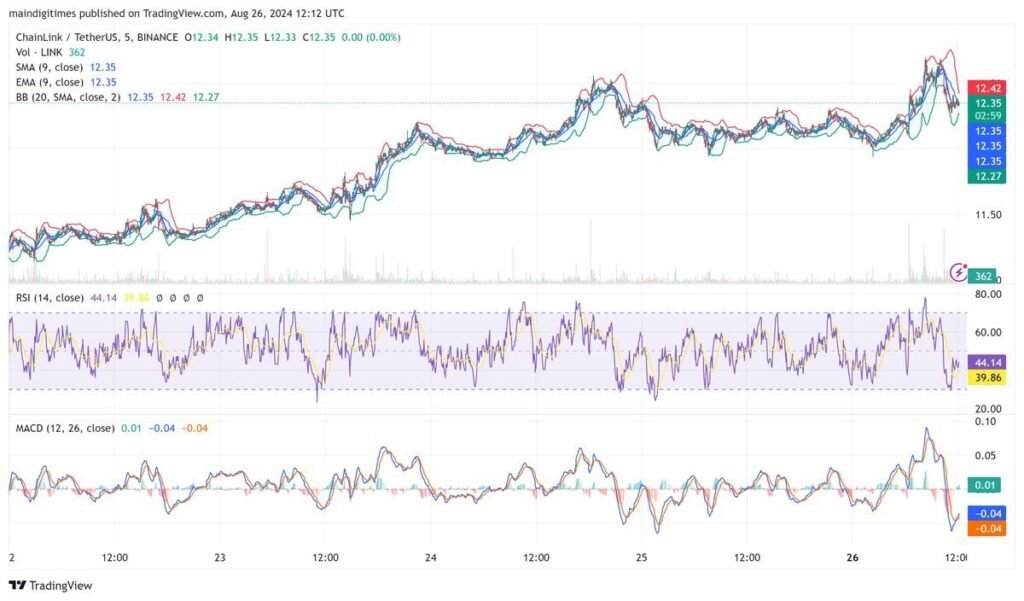
Expanding our view to the 5-day chart, we can see that LINK has experienced a broader range of volatility. The price reached a high of $12.72 before pulling back to the $12.36 level.
The RSI on this timeframe has been oscillating between overbought and oversold conditions, currently sitting at 33.82, indicating that LINK might be oversold at the moment.
The MACD shows a bearish crossover, signaling potential further downside.
The 5-day chart suggests that LINK has faced resistance around the $12.72 mark, and the recent pullback could continue if selling pressure persists.
Traders might consider shorting LINK if it fails to hold the $12.36 support, targeting lower levels around $12.20.
6-Month Price Analysis (2-Hour Chart)

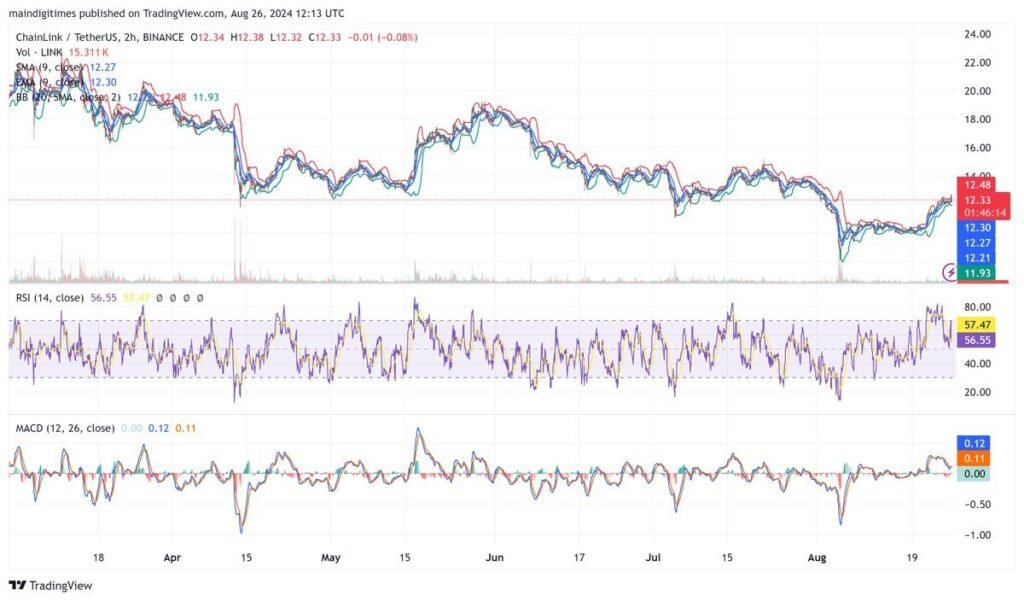
The 6-month chart provides a broader perspective on LINK’s price action. LINK has been in a downtrend since peaking around $24 in April, with the price gradually declining to around $12.
Despite this bearish trend, there has been a recent bounce from the $11.93 level, suggesting some buying interest at lower levels.
The RSI on this chart is at 57.29, indicating a neutral stance, while the MACD shows a slight bullish divergence, hinting at potential recovery.
This chart highlights the critical support at $11.93, which has held firm despite repeated tests.
If LINK can maintain this support level, a bounce towards the $14 resistance is possible. However, if the price breaks below $11.93, it could signal further downside, with potential targets around $11.
Bullish Scenario
In a bullish scenario, LINK manages to break above the $12.37 resistance level, supported by strong volume and positive market sentiment.
The RSI, currently hovering around the 60 level on the daily chart, could push higher towards the 70 mark, indicating increasing buying momentum.
A bullish crossover on the MACD, confirmed by rising histogram bars, would further validate this scenario.
If LINK can sustain a breakout above $12.37, the next target would be the $13 psychological level, followed by the recent high of $14.
Traders might consider going long on LINK, placing stop-loss orders just below the $12.35 support to protect against a potential false breakout.
Bearish Scenario
In contrast, a bearish scenario would unfold if LINK fails to hold the $12.35 support level, leading to increased selling pressure.
The RSI could drop towards the 40 level, indicating growing bearish momentum. A bearish MACD crossover, with a declining histogram, would support this view.
If LINK breaks below $12.35, the next support level to watch would be $12.20, followed by the key $11.93 level observed on the 6-month chart.
Traders might consider shorting LINK if it breaks below $12.35, targeting the $12.20 level, with a stop-loss just above the $12.37 resistance to limit potential losses.
Trade Ideas
Based on the technical analysis and the potential scenarios, here are some trade ideas for LINK:
Long Trade:
Enter a long position if LINK breaks above $12.37 with strong volume. Target $13 initially, with a stop-loss placed below $12.35 to minimize risk. Consider adding to the position if the price breaks above $13, aiming for $14 as the next target.
Short Trade:
Consider shorting LINK if it fails to hold the $12.35 support level. Target the $12.20 level, with a stop-loss placed above $12.37. If the price breaks below $12.20, consider adding to the short position, targeting the $11.93 support.
Range Trade:
Given the narrow range observed on the daily chart, a range-bound trading strategy could also be effective. Buy near $12.35 and sell near $12.37, with tight stop-losses on either side to protect against a breakout or breakdown.


