The CAD/USD currency pair has been experiencing significant fluctuations in recent days, reflecting a mix of market sentiment and economic data releases from both Canada and the United States. Currently trading at around 0.7414, the pair has shown both bullish and bearish tendencies, reacting to economic data such as manufacturing numbers and employment figures. This article will provide a detailed technical analysis of the CAD/USD pair using three different time frames: 1-day, 5-day, and 6-month periods. The analysis will be followed by actionable trade ideas with potential entry and exit points, stop-loss levels, and risk management tips.
1-Day Price Analysis

On the 1-day chart, the CAD/USD pair is showing a predominantly bearish trend. The price is currently trading below both the 9-period Simple Moving Average (SMA) and the 9-period Exponential Moving Average (EMA), which are converging around the 0.7422 level. This suggests that the short-term momentum is negative, and the pair is struggling to break above these resistance levels.
The Relative Strength Index (RSI) is at 24.98, indicating that the pair is in oversold territory. This could suggest a potential for a short-term rebound if the bearish pressure eases. However, the Moving Average Convergence Divergence (MACD) indicator shows that the MACD line is crossing below the signal line, reinforcing the bearish outlook for the short term.
The Bollinger Bands (BB) are also suggesting heightened volatility, with the price hugging the lower band at around 0.7413. This suggests that the pair could experience further downside pressure if it fails to maintain support around this level.
Read More: GBP/USD Technical Analysis: Key Levels and Trade Ideas – Sep 25
5-Day Price Analysis

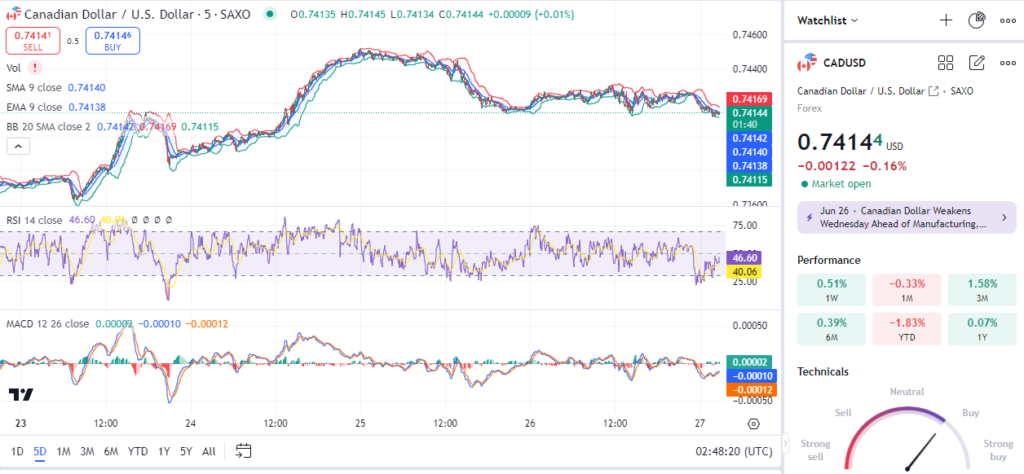
The 5-day chart provides a broader view of the pair’s performance, showing a trend of gradual decline. The price action reveals a clear downtrend with the CAD/USD pair consistently trading below the 9-period SMA and EMA, both hovering around 0.7414 and 0.7413, respectively. The Bollinger Bands are slightly wider compared to the 1-day chart, indicating that volatility has been increasing.
The RSI on this time frame is at 46.60, which is relatively neutral. This suggests that while the pair has been experiencing a downtrend, it has not yet entered oversold territory. This could indicate a period of consolidation before the next move.
The MACD, however, shows that the MACD line is almost touching the signal line from below. This hints at a potential bullish crossover if the price manages to break above the immediate resistance levels. A successful crossover could indicate a short-term reversal, with the next target at the upper Bollinger Band, around 0.7440.
6-Month Price Analysis

Looking at the 6-month chart, the CAD/USD pair has shown a lot of volatility, moving in a wide range between 0.7300 and 0.7600. The pair has been trading above the 9-period EMA and SMA, which are currently at 0.7421 and 0.7425, respectively, indicating a more bullish trend compared to the shorter time frames.
The RSI stands at 51.49, signaling a balanced market without clear overbought or oversold conditions. This neutral stance suggests that the market could move in either direction, depending on upcoming economic data and market sentiment.
The MACD is showing that the MACD line is just above the signal line, which indicates that the bullish momentum is still in play, albeit not very strong. The key resistance level to watch in this time frame is around 0.7600, while the support is around 0.7300. A breakout in either direction could set the trend for the coming weeks.
Read More: HNT/USDT Technical Analysis: Key Levels and Trade Ideas – Sep 24
Trade Ideas and Recommendations
- Short-Term Trade:
- Entry Point: Consider entering a short position around the 0.7420 resistance level, where the 9-period SMA and EMA converge.
- Stop-Loss: Set a stop-loss above the upper Bollinger Band at 0.7435 to protect against unexpected bullish breakouts.
- Take-Profit: Aim for the 0.7400 support level for a short-term profit target, as the pair has been showing a bearish momentum.
- Medium-Term Trade:
- Entry Point: If the pair breaks above the 0.7425 level with strong volume, consider a long position.
- Stop-Loss: Place a stop-loss below the recent low of 0.7400 to minimize risk.
- Take-Profit: Target the upper Bollinger Band around 0.7450, where the pair may face significant resistance.
- Long-Term Trade:
- Entry Point: A breakout above 0.7600 would indicate a strong bullish trend, making it a good entry point for long positions.
- Stop-Loss: Place a stop-loss below 0.7500 to protect against a false breakout.
- Take-Profit: Aim for the next resistance at 0.7700 for a longer-term trade, as the pair has shown the potential to reach these levels in the past.
Risk Management Tips:
- Always use a stop-loss to protect against unexpected market moves.
- Avoid over-leveraging, especially in a volatile pair like CAD/USD.
- Monitor economic news from both Canada and the United States, as it can significantly impact the pair’s movement.
In conclusion, the CAD/USD pair is currently in a bearish phase in the short-term, but it has potential for a bullish reversal in the medium and long-term. Traders should stay vigilant and adapt their strategies based on evolving market conditions.


