Bitcoin (BTC) has seen significant price movements recently, with fluctuating trends observed across different timeframes. The trading pair BTC/USDT has navigated a challenging market environment, reflecting both investor sentiment and broader macroeconomic factors. In this article, we will delve into the technical analysis of BTC/USDT over 1-day, 5-day, and 6-month periods, offering a comprehensive understanding of the trends, indicators, and potential trade opportunities.
1-Day Price Analysis

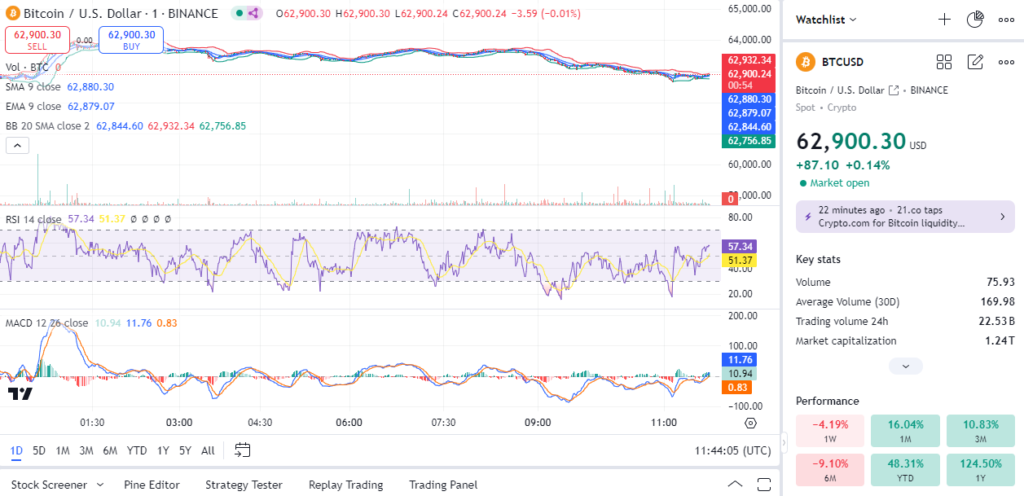
The 1-day chart showcases Bitcoin’s short-term price behavior. At the time of analysis, BTC/USDT trades around $62,900. The price has been relatively stable within a narrow range, hinting at consolidation. Key indicators on the 1-day chart include the following:
- Moving Averages: The 9-period Simple Moving Average (SMA) and the 9-period Exponential Moving Average (EMA) are closely aligned, indicating a lack of strong directional momentum. The SMA at $62,880 and EMA at $62,879 suggest equilibrium, with the price hovering near these averages.
- Bollinger Bands: The bands appear slightly contracted, with the price trading near the middle band. This indicates low volatility, a sign that a significant move could be on the horizon, either upward or downward.
- Relative Strength Index (RSI): The RSI value of 57.34 suggests that the pair is neither overbought nor oversold. A reading closer to 60 indicates mild bullish momentum, but the lack of a breakout above 70 means the upward strength is limited.
- MACD (Moving Average Convergence Divergence): The MACD line (11.76) is slightly above the signal line (0.83), reflecting a slight bullish divergence. However, the histogram is small, which means the buying pressure isn’t yet strong enough to trigger a significant upward move.
Read More: NZD/USD Technical Price Analysis: A Comprehensive Outlook – Sep 28
5-Day Price Analysis

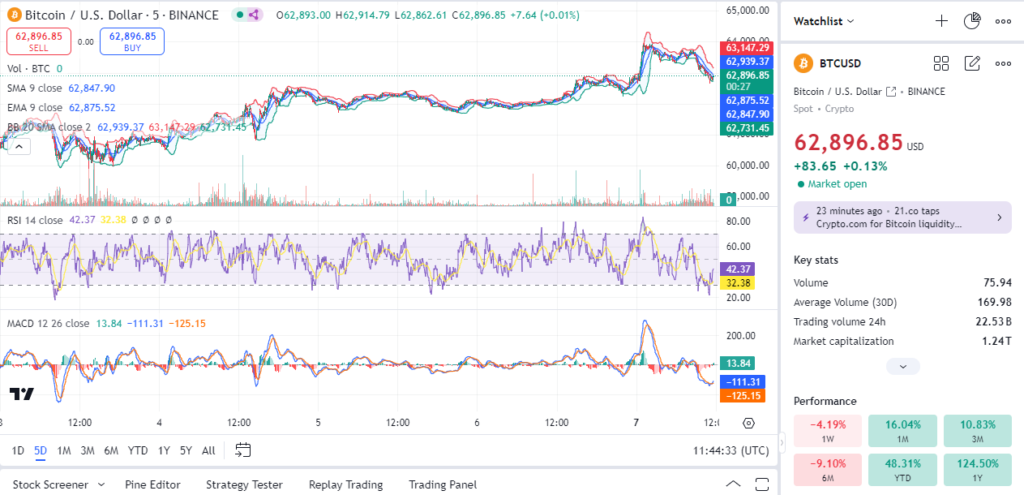
On the 5-day chart, a broader view of the price movement is evident, providing insights into medium-term trends:
- Price Movement: BTC/USDT is trading at approximately $62,896. The recent price action shows a range between $62,800 and $63,147, indicating a period of indecision among traders.
- Moving Averages: The 9-period SMA and EMA are positioned at $62,847 and $62,875, respectively, indicating that the price is testing these support levels. A sustained move above these averages could signal a potential bullish reversal.
- Bollinger Bands: The bands have widened slightly, suggesting increased volatility. The price recently touched the upper band around $63,147 but retraced, which might indicate a temporary exhaustion of buying pressure.
- RSI: The RSI at 42.37 suggests a dip in momentum. This reading places it closer to the oversold zone, indicating potential room for a bounce if buying pressure returns.
- MACD: The MACD reading of 13.84 and signal line of -111.31 highlight a bearish cross. The histogram indicates negative momentum, suggesting that bears are currently in control in the medium term.
6-Month Price Analysis

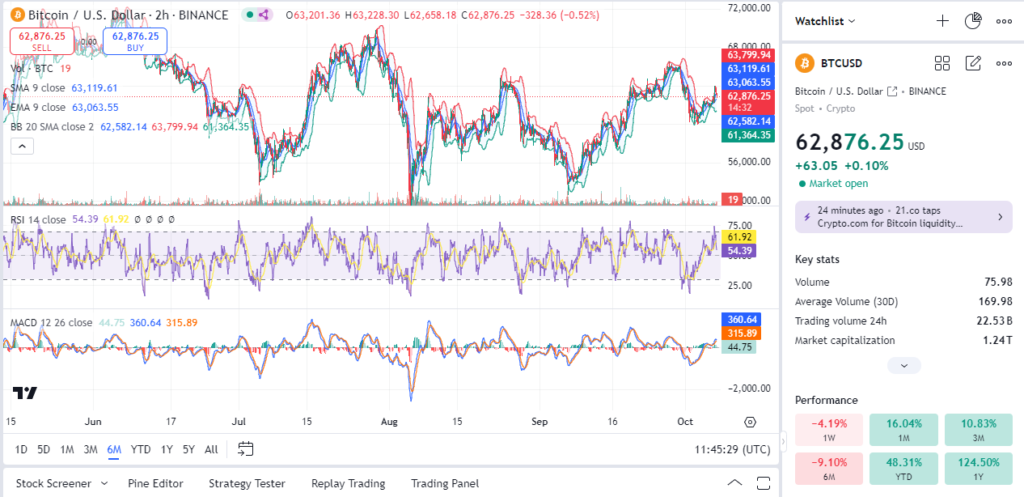
The 6-month chart provides a longer-term perspective, highlighting the broader market structure:
- Price Range: Over the past six months, BTC/USDT has faced a wide range of fluctuations, with the price currently around $62,876. Major support levels are found near $61,364, while resistance levels cluster around $63,799.
- Moving Averages: The 9-period SMA and EMA are positioned at $63,119 and $63,063, respectively. These averages show the importance of the $63,000 level as a pivot zone. A decisive break above this level could trigger further upside momentum.
- Bollinger Bands: The bands remain relatively wide, reflecting the higher volatility that has characterized Bitcoin’s price action over the last several months. With the price trading near the lower band, there is potential for a rebound if buying activity increases.
- RSI: The 6-month RSI stands at 54.39, a neutral reading that reflects consolidation rather than a definitive trend. It suggests that while the bearish momentum has not been strong enough to push the RSI into oversold territory, bulls have also not gained significant control.
- MACD: The MACD value of 44.75 above the signal line of 315.89 suggests bearish momentum remains dominant over the long term, though the convergence hints at possible stabilization.
Read More: USD/INR Technical Analysis: Key Levels and Trade Ideas – Sep 27
Trade Ideas
Based on the analysis of these timeframes, here are a few potential trade ideas for BTC/USDT traders:
- Range Trading Strategy:
- Entry: Consider entering a long position near the support zone around $62,750, especially if price action shows a bounce or reversal pattern on the 1-day chart.
- Exit: Target the resistance level of $63,147 for short-term profits, where selling pressure is likely.
- Stop-Loss: Place a stop-loss below $62,500 to manage risk in case the price breaks down from the current range.
- Risk Management: This setup offers a favorable risk-to-reward ratio, with tight stops to minimize losses.
- Breakout Strategy:
- Entry: Enter a long position if BTC/USDT breaks above the 6-month resistance at $63,799 with strong volume. This would indicate that bulls are regaining control and could push the price toward $65,000.
- Exit: Set an exit target near $65,000 to $66,000, aligning with historical resistance levels.
- Stop-Loss: Use a stop-loss just below the breakout level at $63,500 to protect against false breakouts.
- Risk Management: Ensure the position size aligns with your risk tolerance, as breakouts can lead to volatile price movements.
- Reversal Strategy:
- Entry: For those expecting a potential trend reversal, a short position could be considered if the price fails to sustain above the 9-period EMA and SMA on the 5-day chart.
- Exit: Aim to exit the position near $61,500, the next support level, for a quick profit.
- Stop-Loss: Place a stop-loss above the recent high of $63,147 to protect against sudden upward spikes.
- Risk Management: This is a more aggressive strategy, so adjust position size accordingly and be prepared for quick adjustments.
Conclusion
The BTC/USDT pair remains at a crucial juncture, with price action across different timeframes suggesting mixed signals. While the 1-day chart shows consolidation, the 5-day chart hints at bearish pressure, and the 6-month analysis points to potential stabilization. Traders should watch key levels closely, including the $63,000 mark, and choose strategies that align with their risk tolerance and market outlook. Remember, a disciplined approach with defined entry, exit, and stop-loss levels is essential for navigating Bitcoin’s often volatile price movements.


