
Bitcoin’s recent price action has captured the spotlight once again, with values hovering in the mid-$80,000 range and edging closer to the critical $90,000 level.
A steady uptrend is unfolding in the charts, prompting traders to ask whether this momentum will last—or if headwinds at higher resistance levels might slow the advance. Below, we dive into a detailed technical analysis using data from the latest price movements and chart indicators.
Current Trend: A Closer Look at the Charts
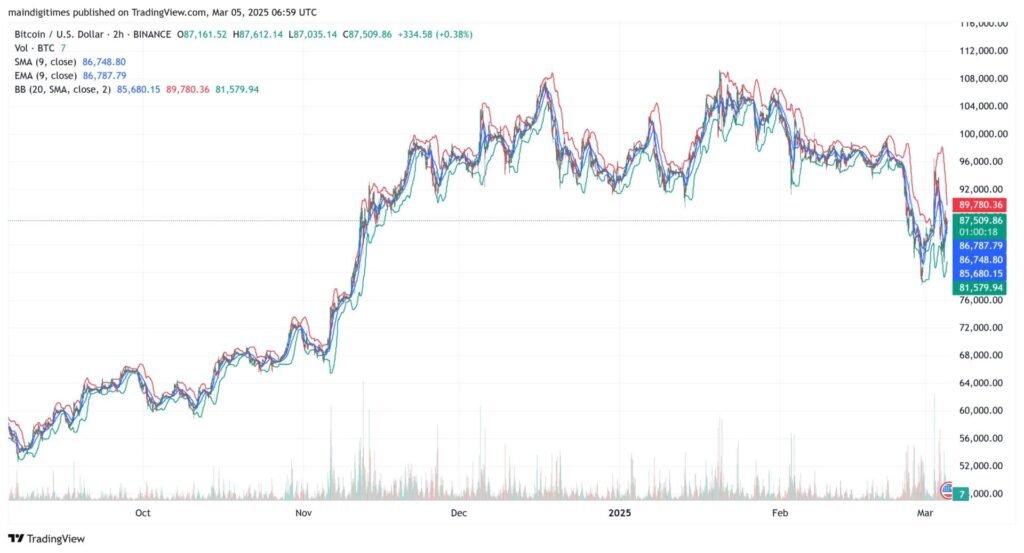
The Bitcoin price, hovering around $87,500 to $87,600, has shown signs of resilience. On the higher timeframes (such as the two-hour and daily charts), BTC remains above key short-term moving averages, suggesting a bullish momentum.
The Simple Moving Average (SMA) at 9 periods and the Exponential Moving Average (EMA) at 9 periods both lie near $86,700–$86,800, while price candles hover just above these indicators. This alignment indicates that buyers currently hold the upper hand.
Furthermore, the Bollinger Bands (on the two-hour chart) feature a middle line around $86,700 and upper and lower bands near $89,780 and $85,680, respectively. Bitcoin’s ability to stay in the upper half of this band envelope underscores the current bullish pressure.
Price consolidations near the band’s midpoint often signal an upcoming move; here, BTC appears to lean toward the upper end, which could support additional upside.
Despite bullish undercurrents, it’s worth noting that trading volume dipped by over 20% based on the 24-hour data. This might hint at temporary profit-taking or a pause in aggressive buying. If volume recovers strongly, it could confirm a continuation of the bullish trend.
Read More: Swing Trading vs. Scalping: Which Strategy Suits You Best?
Technical Indicators: Key Levels to Watch
When evaluating potential short-term moves, various technical indicators can help traders pinpoint support and resistance.
- Short-Term Moving Averages: The 9-period SMA and EMA both lie near the $86,700–$86,800 region, providing critical short-term support.
- Bollinger Bands: A lower band just above $85,600 suggests additional support, while the upper band around $89,700 could turn into near-term resistance.
- Potential Resistance Levels: Beyond $89,700, a key psychological ceiling emerges at $90,000, followed by a more robust barrier at $92,000.
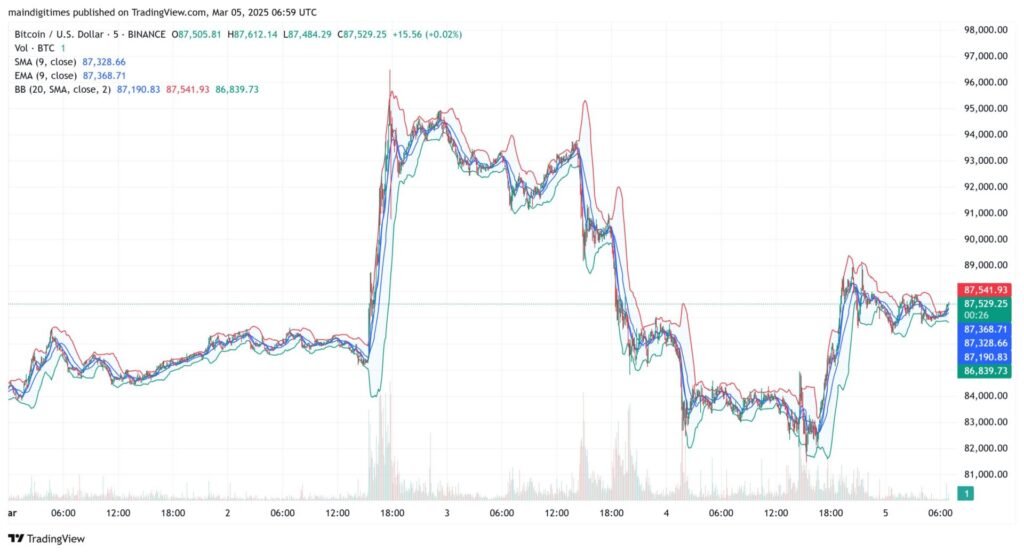
The interplay between these indicators helps shape Bitcoin’s near-term trajectory. On the lower timeframes (like the five-minute and one-minute charts in the screenshots), the price’s continued respect of the middle Bollinger Band line further signals that buyers are stepping in during minor dips.
This pattern can be particularly telling in day trading scenarios, where any break below the lower band (currently near $87,000–$87,200 on shorter intervals) could hint at a short-term retracement.
Projections and Likely Scenarios
Based on the alignment of moving averages and Bollinger Band signals, the overarching sentiment leans bullish. If Bitcoin sustains its position above $86,700 and volume picks up, the next wave of buying could push BTC toward the $90,000 mark.
A clean break above that psychologically important level might trigger further enthusiasm, paving a path to test $92,000. Should the market display robust buying pressure around $90K, the $92K barrier might be tested more quickly than many anticipate.
However, it is not all clear skies. If price rejects near the $89,700–$90,000 area, a deeper pullback could ensue. In that case, the first defensive line is found around $85,600–$86,000, in alignment with the lower Bollinger Band on the two-hour chart.
A breach of that region might spark additional selling, possibly dragging the price back toward $83,000–$84,000, where previous consolidation zones offered support.
Looking ahead, a measured approach is advisable. Monitoring volume spikes in tandem with candle formations around key levels will offer the clearest signals of the market’s next move.
Shorter timeframes may show choppy swings, but the daily and two-hour charts suggest that bullish momentum remains intact—provided price holds above the short-term moving averages.
Read More: AUD/CHF Price Prediction: 0.55 Support and 0.56 Resistance in Focus for 2025
The Bottom Line
In conclusion, while Bitcoin’s push toward $90,000 has garnered much attention, the real test may come at $92,000. Solid breaks above these thresholds could open the door to more ambitious targets. If sellers resurface with enough force to push BTC below major supports, another consolidation phase may be in store. By weighing moving averages, Bollinger Bands, and volume shifts, traders can maintain a fact-based perspective on Bitcoin’s evolving price action.