
Bitcoin’s recent price action around the $85,700–$86,000 mark has sparked curiosity among traders looking for the next big move.
With volatility ticking higher and trading volumes still robust at over $23 billion daily, eyes are on the charts to see whether Bitcoin can maintain its current momentum or face a pullback. Below is a technical deep-dive into the market’s latest signals.
Current Trend: What the Charts Are Saying
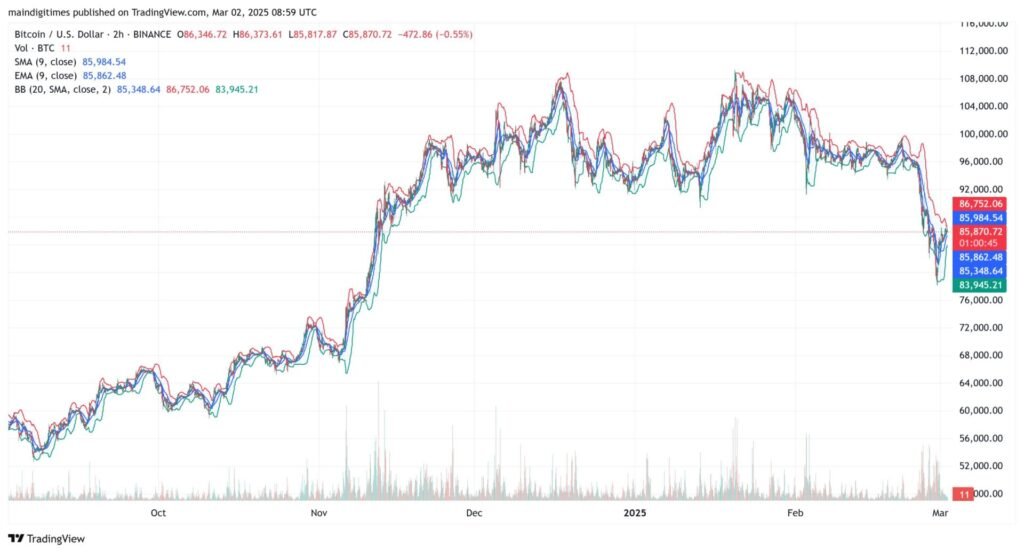
Despite modest intraday fluctuation, Bitcoin has shown signs of resilience near the $85,700 price zone. On the two-hour chart, the cryptocurrency bounced back from a brief dip below $84,000 and now sits just beneath its 9-period Simple Moving Average (SMA), which hovers around $85,984.
Meanwhile, the 9-period Exponential Moving Average (EMA) is closer to $85,862, putting the spot price effectively in line with these short-term trend gauges.
A glance at the Bollinger Bands on the two-hour timeframe suggests that Bitcoin is hovering around its middle band (near $85,350–$85,400), indicating it’s neither overbought nor oversold in this mid-range window. This positioning often points to a phase of price consolidation before a potentially bigger move occurs.
Read More: EUR/AUD Analysis: Bullish Momentum Faces Resistance—What’s Next?
On shorter timeframes (like the five-minute or one-minute charts), the price is oscillating in narrower bands, reflecting minor scalper-driven volatility rather than a drastic directional shift. Overall, the trend is cautiously bullish, supported by higher lows forming over the past few trading sessions.
Technical Indicators at a Glance
Bitcoin’s market cap sits around $1.7 trillion, and its current volume of $23.09 billion (down 60% in 24 hours) demonstrates a dip in immediate trading activity but remains significant enough to sustain short-term momentum. Here is a concise bullet list summarizing the key technical markers:
- SMA (9-period): $85,978 on the shorter charts, acting as minor overhead resistance.
- EMA (9-period): $85,945, closely trailing the price and often serving as dynamic support/resistance.
- Bollinger Bands (20 SMA, 2 SD): Upper band near $86,000–$86,500, lower band in the $83,900–$84,000 region.
The fact that price has repeatedly tested near the upper band on lower timeframes indicates bullish optimism. However, a failure to close decisively above these levels could signal a near-term stall. When combined with a volume dip, this cautionary note suggests traders might wait for a more convincing breakout before jumping in with larger orders.
Support and resistance zones are also becoming clearer. On the downside, $84,000 remains an immediate support, coinciding with a recent short-lived dip that quickly reversed. Below that, $82,000 stands out as a secondary support level from historical pivot points.
On the upside, $86,500 is a key threshold; breaching it convincingly could open the gates toward $88,000 or higher.
Future Price Projections: Consolidation or Breakout?
Based on current indicators, Bitcoin appears primed for a potential push toward $86,500 or $88,000 if bulls can maintain upward pressure. The price’s positioning at or just below short-term moving averages suggests that momentum is not overwhelmingly bullish, but it remains tilted in favor of further gains.
Should Bitcoin break above $86,500 with strong volume, traders might see a swift rally targeting $88,000, a psychologically notable round number and a level of interest to short-term speculators.
On the other hand, if the market encounters increased selling pressure—especially with lower trading volume—Bitcoin may revisit the $84,000 mark. A sustained move below this support could pave the way for a test of $82,000, where the next layer of buyers is likely to emerge based on past trading activity.
Keeping an eye on volume surges around these price points will be essential for gauging whether breakouts (or breakdowns) have real conviction.
Read More: KAITO Price Analysis: Bullish Momentum with Key Resistance at $2.40
In conclusion, Bitcoin’s technical landscape leans slightly bullish but isn’t definitive without a volume-backed break above resistance. Price compression within the Bollinger Bands across multiple timeframes hints at an imminent move—one that could result in either a surge to the higher $80Ks or a dip toward $82,000.
Traders would do well to watch the short-term moving averages, Bollinger Bands, and support/resistance zones closely in the coming sessions. While nothing is guaranteed in the realm of cryptocurrency, these data-driven signals offer valuable clues for Bitcoin’s next act around the $85,000–$86,000 corridor.