Bitcoin (BTC) is currently trading at $97,033.50, marking a 1.42% gain over the past 24 hours, according to data from CoinMarketCap. Despite the slight uptick, the broader trend shows signs of indecision as traders weigh their next moves.
A technical deep dive using Fibonacci retracement and the Relative Strength Index (RSI) suggests BTC is at a pivotal juncture.
Bitcoin Remains Stuck
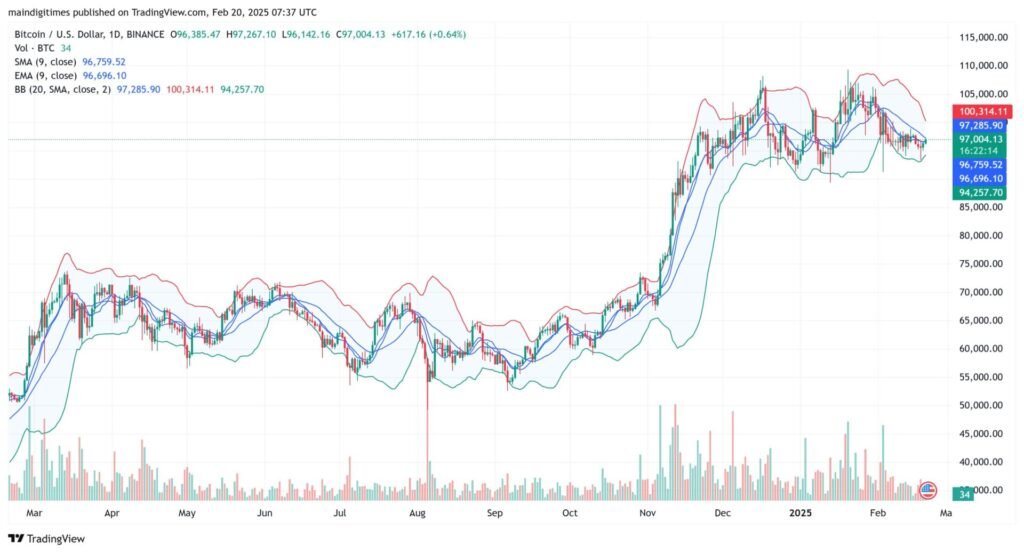
Looking at the daily chart, BTC remains stuck between its short-term moving averages. The 9-day Simple Moving Average (SMA) sits at $96,759.52, while the Exponential Moving Average (EMA) lingers close at $96,696.10.
Prices hovering near these levels indicate the market’s hesitancy. Bollinger Bands are narrowing, a sign of potential upcoming volatility.
From a Fibonacci retracement perspective, plotting from the recent swing low to the local high shows Bitcoin trading near the 61.8% retracement level, a critical support zone that often determines trend direction.
Holding above this level could pave the way for a push toward the $100,000 psychological resistance. A break below, however, might drag BTC down to test support around $94,000.
The RSI on the daily timeframe is hovering around 45, indicating neutral momentum. This reading suggests neither bulls nor bears have a decisive upper hand, though BTC is leaning slightly bearish given the recent failure to break above the $98,000 mark.
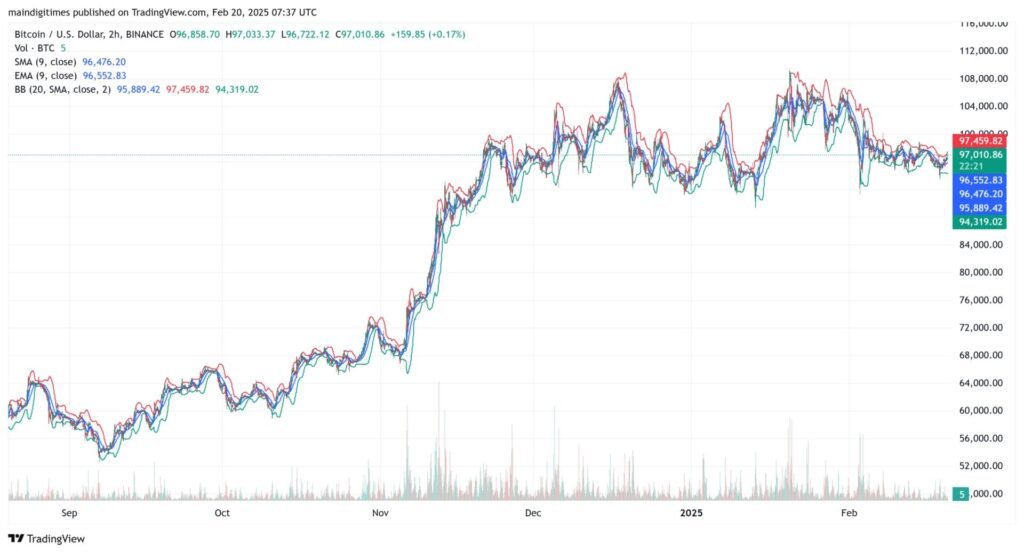
The 2-hour chart echoes this sentiment with repeated attempts to breach $97,500 facing seller resistance.
Volume data supports this narrative. While the market cap stands at $1.92 trillion, the 24-hour trading volume has declined by 27.36% to $28.1 billion. Lower volume during price increases often signals weak buying conviction, raising caution flags for bullish traders.
Read Now: Crypto Trading Hours: When to Buy and Sell for Maximum Profit?
Key Technical Zones:
- Immediate Resistance: $97,500 – $98,000
- Major Resistance: $100,000 (psychological level)
- Immediate Support: $96,000
- Critical Support: $94,000 – $95,000
The 5-minute and 2-hour charts show erratic price swings, typical of short-term traders dominating the market. However, the daily structure suggests a larger move is imminent.
If Bitcoin consolidates above $97,000, bulls could regain momentum and target $100,000. On the flip side, sustained rejection at the current resistance levels could result in a breakdown toward $94,000.
What’s Next?
BTC’s future direction hinges on whether it can break out of the tightening range. A close above $98,000 could flip market sentiment bullish, potentially reigniting the uptrend toward the $105,000 region.
Conversely, slipping below the 61.8% retracement level may see BTC retesting the lower band around $94,000, with further declines not out of the question if broader market sentiment weakens.
Bottom line: Bitcoin is at a make-or-break point. Bulls need to step up to reclaim lost ground, but with volume thinning and RSI stuck in neutral territory, traders should brace for volatility. Whether BTC breaks north or south from this range will shape the next leg of its journey.
Read More: Ethereum Price Struggles Below Key Resistance: Is a Reversal Coming or More Pain Ahead?