
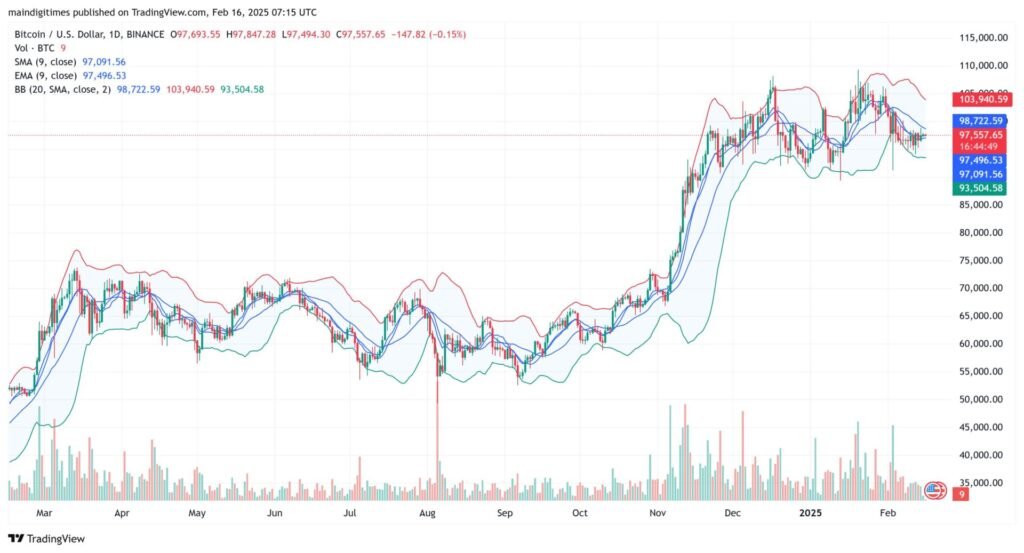
Bitcoin (BTC) is currently trading around $97,557, showing a slight -0.15% decline in the last 24 hours. The market structure indicates a period of consolidation following a strong bullish trend observed in the past few months.
Utilizing technical indicators such as Fibonacci retracement and RSI, we can assess whether Bitcoin is primed for further gains or due for a correction.
Fibonacci Retracement Analysis
To gauge potential support and resistance levels, we applied Fibonacci retracement levels to the most recent price swing:
- 0.236 Level: ~$94,500
- 0.382 Level: ~$91,000
- 0.5 Level: ~$87,500
- 0.618 Level: ~$84,000 (strongest support area)
- 0.786 Level: ~$79,000
Bitcoin has recently bounced near the 0.236 level ($94,500) and is attempting to reclaim its 97,500-98,000 resistance range. If bulls fail to push above this level, BTC might test the 0.382 ($91,000) or 0.5 ($87,500) retracement zones, which have historically acted as demand zones.
Relative Strength Index (RSI) Assessment
Examining RSI across different timeframes:
- Daily RSI: ~55 (Neutral zone)
- 2-Hour RSI: ~48 (Slightly bearish)
- 5-Minute RSI: ~50 (Balanced)
The RSI across major timeframes suggests a lack of strong momentum in either direction. A push above 60 on the daily RSI could confirm a bullish continuation, while a break below 40 may indicate increasing sell pressure.
Read More: XRP/USD Technical Analysis: Key Levels and Trade Ideas – Oct 7
Moving Averages & Bollinger Bands
- SMA (9, Close): ~$97,091
- EMA (9, Close): ~$97,496
- Bollinger Bands:
- Upper: ~$103,940
- Lower: ~$93,504
- Mid: ~$98,722
BTC is currently hovering near the middle Bollinger Band, suggesting a neutral stance. A breakout above $98,700 (mid-band) would indicate bullish momentum, while a break below $93,500 (lower band) could lead to increased selling pressure.
Key Support & Resistance Zones
- Immediate Support: $94,500 (0.236 Fib) and $91,000 (0.382 Fib)
- Strong Support: $87,500 (0.5 Fib) and $84,000 (0.618 Fib)
- Immediate Resistance: $98,700 (Mid Bollinger Band) and $103,900 (Upper BB)
- Breakout Target: $110,000+ if BTC clears $103,900 resistance convincingly.

Market Outlook & Future Projections
Bullish Scenario:
- A breakout above $98,700-$100,000 with volume confirmation could push BTC towards $103,900, and if momentum persists, a retest of $110,000 is plausible.
- RSI needs to trend above 60, and the daily close should remain above the 9-day EMA ($97,500) to maintain bullish strength.
Bearish Scenario:
- Failure to reclaim $98,700 may push BTC towards $94,500-$91,000, with further downside potential to $87,500-$84,000.
- A break below $84,000 could invalidate the recent bullish structure, potentially leading to a deeper correction towards $79,000.
Read More: ETH/USD Technical Analysis: Key Levels and Trade Ideas – Oct 7
Conclusion
Currently, Bitcoin is in a neutral-to-slightly-bearish stance, with key resistance at $98,700-$100,000 and strong support near $94,500-$91,000. Traders should watch for a breakout confirmation before positioning for the next move. A decisive close above $100,000 will confirm bullish continuation, whereas a rejection could see BTC testing lower Fibonacci levels for support.