
Are you wondering whether the Australian Dollar/Swiss Franc pair is poised for a turnaround or set to extend its recent losses? Despite a steady downward drift in recent sessions, there’s still room for tactical plays around key price levels. Below, we dive into a purely technical perspective on AUD/CHF, focusing on the 0.55 and 0.56 thresholds that are drawing trader attention.
Read More: Swing Trading vs. Scalping: Which Strategy Suits You Best?
Current Market Overview
At the time of writing, AUD/CHF is hovering around 0.554, retreating from highs near 0.58 seen a few weeks back. The overarching mood is cautious, as the pair has seen a consistent series of lower highs and lower lows on the short-term and medium-term charts. A glance at the 5-minute chart confirms this downward slope, with each rally short-lived and followed by fresh selling pressure.
On the 2-hour timeframe, the pair’s descent from 0.5700+ levels in late February to the current 0.554 region speaks volumes about the ongoing bearish sentiment. The broader context reveals that economic uncertainties—both in Australia’s commodity markets and in global safe-haven flows toward Switzerland—have amplified the Swiss Franc’s appeal. This has placed additional selling pressure on AUD/CHF and contributed to the downward trend.
Despite this sustained softness, we’re now approaching a critical juncture near 0.55, which holds psychological significance. Traders are keen to see if this support will spark a relief rally or if weakness will persist.
Technical Indicators and Chart Analysis
Shorter-term moving averages, such as the 9-period Simple Moving Average (SMA) and 9-period Exponential Moving Average (EMA), are tracking below longer-term benchmarks on the lower timeframes, reinforcing the near-term bearish momentum. Moreover, these moving averages have consistently remained above the price candles on the 1-minute and 5-minute charts, underscoring sellers’ control.
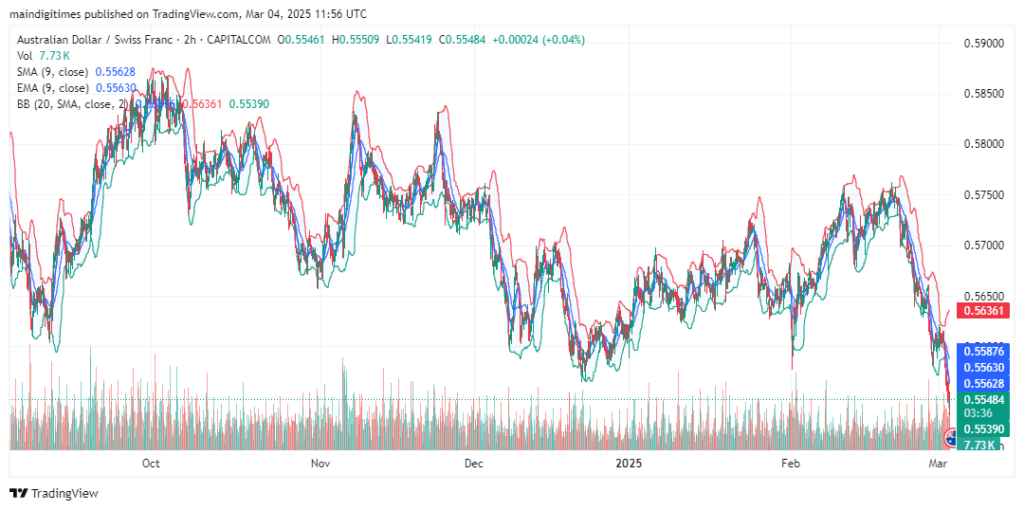
On the 2-hour chart, we see repeated tests of the Bollinger Band midline, which has served more as an overhead barrier than support in recent weeks. Each attempted bounce off the lower band has been met with fresh selling activity. Bollinger Bands are also widening—an indication of elevated volatility that can lead to swift moves in either direction.
The volume profile further confirms the story of short-lived rallies. Notable spikes in volume often occur around minor support regions, only to be reversed when the pair attempts to approach prior highs. This cyclical pattern exemplifies how bears have the upper hand, albeit not without occasional bullish forays.
In the grand scheme, resistance at 0.56 is now the immediate hurdle for any rebound. Above that, 0.565 could emerge as the next level to watch, where the pair consolidated before its latest move down. On the support side, the major psychological floor lies around 0.55, and if it fails, 0.545 could be the next key zone.
Price Projection and Key Levels
Despite current pressures, AUD/CHF may see short-term bounces, but breaking the overall downtrend will require a decisive move above 0.56. Traders and analysts alike will be monitoring the following levels:
- Support:
- 0.55 (psychological threshold)
- 0.545 (potential next line of defense)
- Resistance:
- 0.56 (short-term barrier)
- 0.565 (previous consolidation zone)
Looking ahead, if the pair closes decisively above 0.56, we could see a sustained push toward 0.565 in the weeks to come. This move would likely signal a shift in trader sentiment, at least in the short term, and might open the door to further upside exploration near the mid-0.57 range. Conversely, a firm breach below 0.55 could trigger additional downside toward 0.545 or even lower, reaffirming the broader downtrend.
Read More: HODL vs. Day Trading: Which Crypto Investment Strategy Works Best?
In conclusion, technical indicators point to an ongoing bearish trajectory but do leave room for a corrective bounce if 0.55 holds firm. The low-level momentum favors sellers, yet the psychological relevance of 0.55 suggests that bullish speculators may step in here. Keep an eye on candlestick closes around this zone, volume spikes, and how the pair behaves near the 9-period SMA and EMA. Any break above 0.56 on strong volume could usher in a short-term reversal, while a slip under 0.55 would likely reinforce the downtrend and tempt further selling.
Overall, the Australian Dollar/Swiss Franc remains at a pivotal crossroad. As with any currency pair, fundamentals will eventually weigh in; however, from a strictly technical standpoint, watching 0.55 and 0.56 closely will be key for mapping out the pair’s next meaningful move.