The ETH/USDT trading pair has shown significant movements over the past few days, with Ethereum’s price experiencing fluctuations that mirror market sentiment and broader trends in the cryptocurrency space. Currently trading around the $2,297 mark, Ethereum has seen a slight recovery, gaining 1.06% over the past day. However, its longer-term performance reveals both opportunities and risks for traders. In this article, we’ll dive into the technical analysis of the 1-day, 5-day, and 6-month price charts to provide actionable insights and potential trading strategies.
1-Day Price Analysis
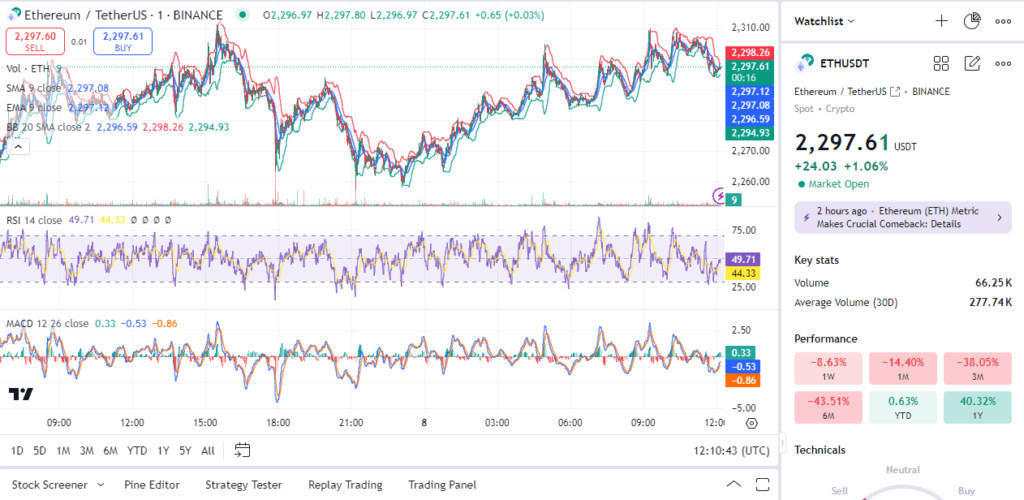
In the 1-day (or 1-minute interval) chart, Ethereum’s price shows a clear consolidation pattern, oscillating around the $2,297 mark. The RSI (Relative Strength Index) hovers at 49.71, indicating neutral momentum with no clear overbought or oversold signals. However, the slight downward trend in the RSI suggests that selling pressure may be increasing. The MACD (Moving Average Convergence Divergence) is hovering near the zero line, showing that bullish momentum has weakened but not entirely reversed.
The presence of both the SMA (Simple Moving Average) and EMA (Exponential Moving Average) lines close to the current price level reinforces this short-term consolidation. With resistance near the $2,310 level and support at $2,294, traders can expect this range to hold unless a breakout occurs. Bollinger Bands show relatively tight constriction, hinting that a breakout may be imminent.

Read More: BTC/USDT Technical Price Analysis: Trade Ideas – Sep 8
5-Day Price Analysis
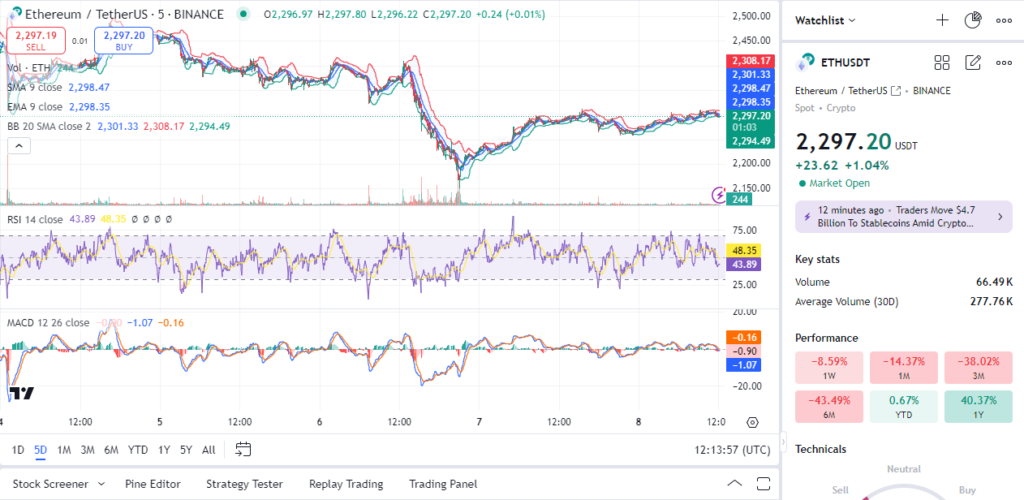
Moving to the 5-day (or 5-minute interval) chart, the ETH/USDT pair displays a broader recovery trend after experiencing a dip in the past few days. After hitting a low of $2,150, Ethereum rebounded, finding support around $2,297, which has been tested multiple times. The RSI is at 48.35, slightly below the midpoint, indicating that there is still room for upside movement if buying pressure increases.
The MACD indicator has dipped below the signal line, reflecting some bearish sentiment in the short-term, though the price has recovered somewhat. The SMA and EMA levels for the past 5 days are showing signs of convergence, suggesting a lack of strong trend direction. This consolidation phase could be a build-up for either a breakout or breakdown in the near term.
In terms of volume, the 5-day chart shows a steady decline, which could indicate reduced interest from both bulls and bears as they await a catalyst for the next significant move.

Read More: USD/ZAR Technical Analysis: Key Levels and Trade Ideas – Aug 28
6-Month Price Analysis
Looking at the 6-month chart (2-hour intervals), Ethereum has experienced considerable volatility, moving from highs of nearly $3,000 down to the current levels near $2,297. This longer-term view highlights a bearish trend, with lower highs and lower lows being formed since June. The RSI is at 49.53, close to neutral but leaning slightly toward bearishness.
The MACD shows more decisive bearish signals with a significant negative divergence from the signal line. Ethereum seems to be struggling to break out of its downward channel, and the recent failed attempt to surpass the $2,300 resistance level suggests that bears still hold control. The SMA and EMA are positioned close to each other but tilted downward, indicating a bearish crossover.
Additionally, the Bollinger Bands on the 6-month chart are wider, reflecting increased volatility in the market. Ethereum’s previous rally was cut short near $2,500, and now it seems to be consolidating in the $2,300 to $2,250 range, with $2,200 acting as a crucial support level.

Trade Ideas
Given the analysis across different timeframes, Ethereum is currently at a critical juncture where it could either break out of its consolidation or continue its downtrend. Here are some actionable trade ideas based on the analysis:
- Entry Point: For those looking to go long on ETH/USDT, an entry point around $2,294 (support level) could offer a low-risk opportunity. The Bollinger Bands’ tightening suggests a possible price squeeze, and if Ethereum breaks above $2,310, we could see it test the next resistance level at $2,350.
- Stop Loss: Place a stop-loss order slightly below the $2,280 level to protect against downside risk, especially if Ethereum fails to hold the support level. This would prevent exposure to further downside movement, which could lead the price toward the $2,200 mark.
- Exit Strategy: For a bullish position, consider taking profits around $2,350 to $2,375 if the price manages to rally past the $2,310 resistance. Keep an eye on the RSI and MACD to ensure that bullish momentum is strong before holding for further gains.
- Bearish Scenario: If Ethereum fails to break the $2,310 resistance and begins to decline, a short position could be considered with an entry near $2,300 and a stop-loss above $2,325. The price could target $2,250 as the next support level, with an extended target of $2,200 in the event of further bearish momentum.
- Risk Management: Traders should allocate no more than 1-2% of their total capital to each trade, setting appropriate stop-loss orders to manage risk. Given Ethereum’s volatility, consider adjusting your position size and risk-reward ratio accordingly. For long-term investors, holding Ethereum in a wider range between $2,200 and $2,400 may be a viable strategy, as long as key support levels are respected.
Conclusion
The ETH/USDT pair is currently in a consolidation phase, and the upcoming price action could dictate its direction for the rest of the week. On a short-term basis, it seems neutral with a slight bullish bias, while the longer-term trend remains bearish. Traders should keep an eye on key levels like $2,310 for a breakout or $2,294 for a potential breakdown. Effective risk management, including proper stop-loss levels and position sizing, is crucial given Ethereum’s historical volatility.


