The British Pound (GBP) has been on a tear against the Australian Dollar (AUD) lately, capturing traders’ attention with its impressive climb toward the 2.06 mark. In this article, we’ll use the latest technical data—reflected in the 1-minute, 5-minute, and 2-hour charts—to pinpoint the key price levels, discuss the prevailing trend, and offer a clear outlook for where GBP/AUD could be headed next.
Read More: The Best Crypto Indicators for Long-Term Investing
Current Market Overview
GBP/AUD has seen a notable surge over the past few weeks, driving the pair from the lower 1.90s (as observed on longer-term charts) up to recent highs just above 2.06. Short-term movements also show intraday swings where minor pullbacks find support around 2.05 before another bounce. This consistent buying pressure underscores a bullish trend that has been in play since the tail end of last year.
Observing the pair’s 2-hour chart reveals a steady series of higher highs and higher lows. After forming a base near 1.95 in late 2024, GBP/AUD gradually gained steam through the first quarter of 2025. The pair is now approaching a key psychological threshold near 2.06–2.07, an area that may either serve as a springboard for a further rally or prompt a reversal if sellers show up in force.
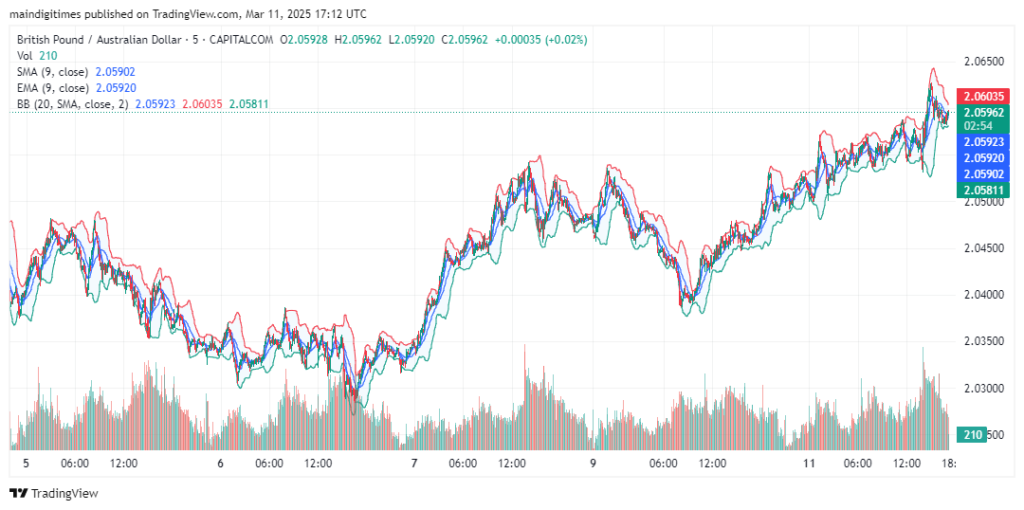
On the shorter timeframes (1-minute and 5-minute charts), we see well-defined bursts of upward momentum, interspersed with brief corrective phases. Volume spikes often accompany these moves, hinting that institutional traders are actively pushing the market. Such intraday action typically denotes a healthy trend, where each dip attracts fresh buying interest.
Key Technical Indicators
From the provided screenshots, three technical indicators stand out:
- 9-Period SMA and EMA: On both the 1-minute and 5-minute charts, the 9-period Simple Moving Average (SMA) and 9-period Exponential Moving Average (EMA) are trending closely around 2.059–2.060. The price has been consistently closing above these lines, suggesting sustained bullish momentum. When the EMA and SMA are beneath the prevailing price, it’s a classic signal that traders are favoring the upside.
- Bollinger Bands (20 SMA, ±2 Deviation): The Bollinger Bands envelope the price between 2.058 and 2.063 on the shorter-term charts, indicating moderate volatility. On the 2-hour timeframe, the upper band has widened noticeably—a sign that price volatility has expanded as GBP/AUD climbed. If the pair continues riding the upper band, it can often remain overbought in a strong uptrend. A decisive break below the midline (currently near 2.05) could, however, foreshadow a deeper pullback.
- Support and Resistance:
- Support: The 2.05 area has emerged as a near-term support zone, underpinned by a cluster of recent lows on the smaller charts. The next significant layer of support could lie around 2.03, matching a pivot from earlier in the month.
- Resistance: On the 2-hour chart, 2.065–2.07 stands out as an immediate resistance band. A surge beyond 2.07 would put 2.08 (and possibly higher) in the crosshairs, especially if accompanied by robust trading volume.
Outlook and Price Forecast
The overall tone is bullish, with GBP/AUD enjoying upward momentum backed by both short- and medium-term technical cues. Despite periodic dips, buyers have stepped in each time the market approached or tested 2.05, reinforcing that level’s role as a springboard for further gains.
However, traders should also remain vigilant about possible corrections. If risk sentiment shifts suddenly—perhaps on economic data surprises or changes in monetary policy—GBP/AUD could break below its immediate support. A sustained dip under 2.05 might open the door toward the 2.03 region, where buyers could regroup and attempt another rally.
- In a bullish scenario, if the pair sustains a break above 2.07, momentum may fuel a run toward 2.08 or higher. The most recent upsurge in late February shows how quickly the pair can climb once it clears significant resistance.
- In a bearish scenario, increased selling pressure could see GBP/AUD retrace toward 2.05. Breaching that support might bring about a deeper pullback, yet it would likely need heavier volume and a shift in market bias to fully reverse the ongoing bullish trend.
Read More: Weekend vs. Weekday Crypto Trading: Which Is More Profitable?
In conclusion, GBP/AUD is poised for further gains as long as it holds above its strong support zones and continues to close above its short-term moving averages. A breakout beyond 2.07 could confirm the next leg of the uptrend, while a slide below 2.05 would introduce a short-term bearish correction. By keeping an eye on moving averages, Bollinger Bands, and key support/resistance levels, traders can better anticipate when the pair might surge higher—or head back down for a much-needed breather.