
If you’ve been following ZIGChain, you’ve likely noticed its recent fluctuations around the $0.09–$0.10 range. Despite bouts of selling pressure, ZIGChain has managed to hold above a critical support level, suggesting that momentum could shift at any moment. In this article, we’ll review the most recent charts, analyze key technical indicators, and explore whether ZIGChain is setting up for a bullish breakout—or if a pullback is more likely.
Read More: The Best Crypto Indicators for Long-Term Investing
Section 1: Current Market Overview
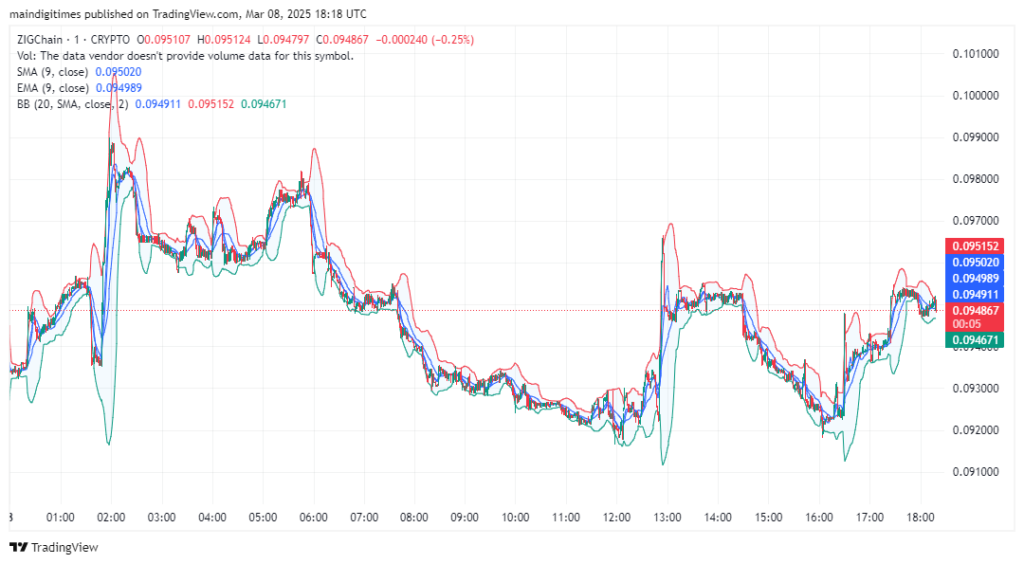
ZIGChain is hovering near $0.0945, down slightly on the day. The 24-hour chart, as seen in the provided screenshots, shows a dip toward $0.0916 before rebounding, all while failing to reclaim the intraday high around $0.1033. This short-term movement highlights a market that is testing both its lower and upper ranges frequently, reflecting uncertainty among traders.
From a broader perspective, the two-hour chart reveals that ZIGChain has been in a gradual decline from late last year, after peaking above $0.19. Since then, the token appears to have established a series of lower highs, pointing to a bearish medium-term trend. However, each time ZIGChain has approached the $0.09 mark, buying activity has picked up, suggesting that level acts as strong support.
Because of this support, sentiment may be on the verge of switching gears. The recent daily bounce from around $0.091 to nearly $0.095 also underlines how quickly ZIGChain can move when volume kicks in. Currently, the market cap stands at $133 million with a 24-hour trading volume near $5 million, signaling modest, but consistent, investor interest.
Section 2: Technical Indicators and Key Levels
When analyzing ZIGChain’s charts, several indicators stand out:
- Moving Averages (MA): On shorter time frames (1-minute to 15-minute), both the 9-day Simple Moving Average (SMA) and 9-day Exponential Moving Average (EMA) hover close to the current price (around $0.094–$0.095). This clustering often indicates a sideways phase or consolidation, where momentum has yet to strongly favor buyers or sellers.
- Bollinger Bands: The 20-day SMA at roughly $0.094 (the middle of the Bollinger Bands) is acting as a pivot point on the price. ZIGChain has tested the lower band near $0.091 multiple times. A firm close above the upper band—currently around $0.10—could signal the start of a bullish trend.
Here is the only bullet list in this article:
- Support Zone: $0.09
- Immediate Resistance: $0.10–$0.103
- Potential Upside Target: $0.12
ZIGChain’s ability to maintain price action above the 9-day EMA will be crucial. If sellers fail to push it below the $0.09 support, bulls may seize momentum. Conversely, an extended close under the 9-day SMA could open the door to further downside, potentially revisiting lower levels around $0.085.
Read More: Swing Trading vs. Scalping: Which Strategy Suits You Best?
Section 3: Price Forecast and Next Steps
Short-Term Outlook (Next Few Days):
Currently, ZIGChain appears slightly range-bound as the short-term MAs flatten out. If the price can reclaim $0.10 and consolidate there, it would suggest that buyers have regained control. We could then see a run toward the next significant ceiling at $0.103. A break and daily close above this level would likely be interpreted as a bullish indicator, potentially triggering a rally toward $0.12.
Medium-Term Perspective (Next 2–4 Weeks):
On the two-hour and daily time frames, the broader downtrend since last year’s high near $0.19 remains intact. That said, if ZIGChain stays above $0.09 and forms higher lows in the coming weeks, we could witness the first real shift in momentum for 2025. Technical traders will watch for increasing trading volume and a rising RSI to confirm that a bullish reversal is underway. A failure to hold above $0.09, however, might encourage more sellers, dragging the price toward the mid-$0.08 zone before any recovery can occur.
Longer-Term Potential (Next 3–6 Months):
With a market cap around $133 million and a circulating supply nearing 1.4 billion ZIG, ZIGChain remains a mid-cap project that can see rapid price swings when new developments or partnerships emerge. Should market-wide sentiment improve, accompanied by technical breakouts on the chart, ZIGChain could target $0.12 and potentially climb toward $0.15 over a few months. On the flip side, if negative sentiment prevails, a retest of the previous lows near $0.08 may be inevitable.
While ZIGChain’s price action has been choppy, the $0.09 support level stands out as a pivotal line in the sand. As long as ZIGChain defends that region, the possibility for a move above $0.10 and toward $0.12 remains on the table. Technical indicators like the 9-day SMA, 9-day EMA, and Bollinger Bands all point to a market in consolidation mode—one that could swing bullish if buyers reassert themselves. Traders and investors should monitor volume spikes and chart confirmations closely, as these signals will help determine whether ZIGChain gears up for another leg higher or surrenders to renewed selling pressure below the crucial $0.0