
MEW has captured the attention of many traders after a notable drop in recent sessions, slipping from highs near $0.0035 to its current price around $0.0022. Despite today’s 21.8% decline, there is growing curiosity about whether this level could provide a base for the token to rebound toward $0.003, or if further downside awaits. In this article, we will analyze current market conditions, examine key technical indicators, and provide a fact-driven outlook on MEW’s possible price trajectory.
Read More: The Best Crypto Indicators for Long-Term Investing
1) Current Market Overview
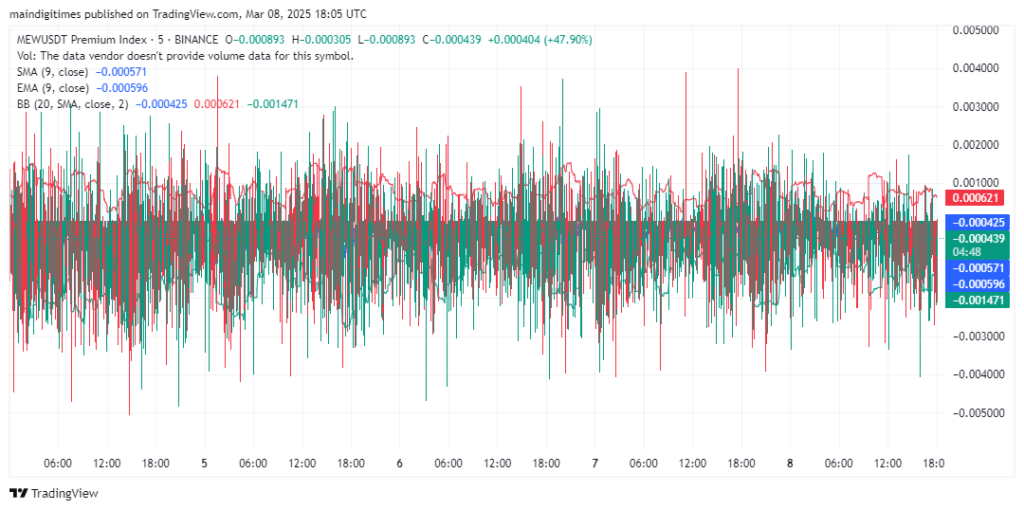
MEW’s market capitalization stands at around $201 million, while its 24-hour trading volume hovers close to $5.5 million. The coin’s daily range has been wide—between $0.00181 and $0.00357—indicating substantial volatility. Looking at the one-minute and five-minute chart snapshots, the MEW/USDT Premium Index (as shown in the screenshots) oscillates sharply in the negative and near-zero territory, hinting at heightened intraday fluctuations. This level of intraday noise can unsettle traders, although such volatility sometimes precedes a directional move.
On the higher-timeframe two-hour chart, MEW appears to have spent most of the past few months trading in a tight band, with a few dramatic spikes and dips that quickly reverted to the mean. These large wicks signal the potential for rapid price movements—either to the upside or the downside. Meanwhile, the most recent CoinGecko data shows MEW’s price sliding roughly 21% on the day. This drawdown points to a short-term bearish sentiment gripping the market, especially given the sudden drop from above $0.003 to near $0.0018 earlier in the day. However, the current stabilization around $0.0022 raises the question: is this a mere bounce or the beginning of a recovery?
2) Technical Indicators and Key Levels
The moving averages on the shorter timeframes—particularly the nine-period Simple Moving Average (SMA) and Exponential Moving Average (EMA) displayed in the screenshots—drift in negative territory, confirming that recent price action has been largely below these trend lines. When a token consistently trades beneath its short-term SMAs and EMAs, it often reflects a bearish trend. Yet, if MEW can break convincingly above these moving averages, bullish momentum may begin to build.
Meanwhile, the Bollinger Bands on the premium index charts show wide expansions, signifying volatile market swings. In bullish phases, price typically rides the upper band before consolidating. In bearish conditions, candles can hug or pierce the lower band. MEW’s repeated dips into negative territory on the one-minute and five-minute premium indexes highlight strong short-term volatility, though the token’s actual spot price on market trackers like CoinGecko is steadier near $0.0022.
Although we do not have a direct view of MEW’s RSI (Relative Strength Index) from the provided charts, the deep intraday plunge suggests that if an RSI were overlaid, it might register oversold levels—potentially hinting at a short-term bounce. Of course, oversold readings alone do not guarantee reversal, but they can increase the likelihood of at least a temporary price recovery.
- Key support levels: $0.0020, $0.0018
- Key resistance levels: $0.0025, $0.0030
Read More: Swing Trading vs. Scalping: Which Strategy Suits You Best?
3) Price Projections and Final Thoughts
From a purely technical standpoint, MEW sits at a crossroads. The recent steep decline has placed the price just above crucial support near $0.002, making this level a critical battleground. If selling pressure continues and drives MEW below $0.0018 on high volume, the next phase of downward price discovery could kick in. Under those circumstances, a test of lower price zones—potentially closer to $0.0015—would not be out of the question.
On the flip side, a successful defense of $0.002 combined with renewed trading volume may allow bulls to regain the upper hand. If buying momentum intensifies, MEW could reclaim its short-term moving averages and push toward the nearby resistance around $0.0025. A break above that threshold, particularly if accompanied by a surge in volume, might embolden buyers to aim for the $0.003 region—an area MEW briefly visited before its latest downturn.
Overall, the trend is currently slanted bearish, but with volatility this high, rapid shifts in direction remain a possibility. Traders will want to monitor price action closely, especially around the noted support and resistance zones. A clear break in either direction—with strong volume behind it—should signal the next significant move. While a rally toward $0.003 remains plausible if support holds, caution is warranted until the token confirms a stable bottom.
In summary, MEW’s near-term prospects hinge on whether $0.002 can hold as a solid foundation. Keep an eye on short-term moving averages, volatility indicators, and volume spikes for clues on the token’s direction. If the market mood improves and demand picks up, a recovery toward $0.003 might be around the corner. If not, the bear trend could deepen, and lower price levels could come into play.