
The Euro (EUR) to New Zealand Dollar (NZD) pair has been on a remarkable run lately, catching the attention of traders looking for strong momentum plays. After climbing steadily over recent weeks, the pair briefly topped out above 1.9050 before pulling back slightly. This article takes a closer look at the charts to see whether EUR/NZD can maintain its bullish trajectory toward 1.92—or if a deeper correction is on the horizon.
Read More: The Best Crypto Indicators for Long-Term Investing
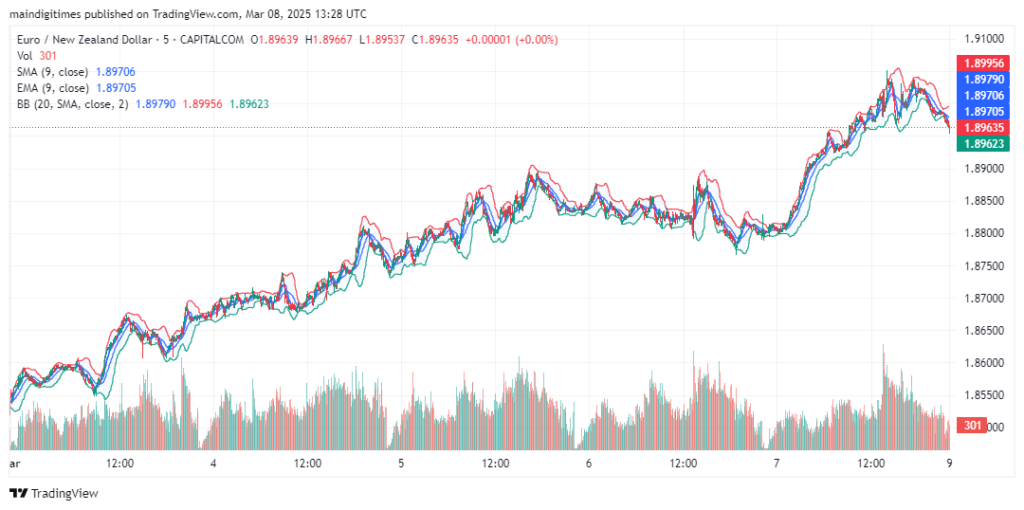
1. The Uptrend in Focus
EUR/NZD has displayed a pronounced bullish trend, particularly visible on the two-hour chart dating back to the final months of 2024. From lows in the 1.74 region, the pair surged past 1.90 in early March 2025. Price action shows consistent higher highs and higher lows—a textbook sign of a rising market.
On shorter timeframes (the one-minute and five-minute charts), you can see intraday fluctuations, but the overall movement remains upward. Even when short-term pullbacks occur, buyers have repeatedly stepped in around key support zones, pushing the pair to new highs.
A glance at the candlestick structure also indicates strong buyer interest. For instance, each time the pair has neared a psychological level—like 1.90—it has consolidated briefly before launching higher. Although the most recent chart data shows a minor retreat from just above 1.9050, this appears more like a typical pause in a bullish trend rather than a full-blown reversal.
2. Technical Indicators: Moving Averages and Bollinger Bands
Moving averages help confirm EUR/NZD’s bullish momentum. Both the Simple Moving Average (SMA) and Exponential Moving Average (EMA)—set to a nine-period lookback—are sloping upwards and currently lie near 1.897 on the shorter-term charts. This positioning provides two takeaways:
- Supportive MAs: Price is still trading slightly above these moving averages, indicating the upward trend remains intact.
- Bullish Crossovers: The SMA and EMA lines consistently overlap in positive territory, reinforcing the likelihood that buying pressure still outpaces selling.
Bollinger Bands, set to a 20-period SMA with a two-standard-deviation envelope, are relatively wide on the two-hour chart—often a sign of elevated volatility. The upper band recently soared above 1.9050, aligning with the pair’s recent peak. When price tags the top band and then retracts, it can suggest a short-term cooldown. However, so long as the middle band (around 1.889–1.890) holds as support, traders typically still regard the larger move as bullish.
Key Technical Levels to Watch:
- Immediate Resistance: 1.9050–1.9070 zone. A close above this region would open the door to the 1.92 handle.
- Short-Term Support: 1.8900–1.8920, close to the middle Bollinger Band on some timeframes.
- Stronger Support: 1.8800, which has acted as a springboard on multiple pullbacks in recent days.
Should the price struggle to break 1.9050 convincingly, a deeper pullback toward 1.88 could occur. Conversely, a successful push above 1.9070 might spark new buying interest and drive EUR/NZD closer to 1.92.
3. Price Prediction: EUR/NZD Eyes 1.92 Next
Given the pair’s robust climb over the past few months, the broader technical picture points to sustained bullishness—at least until a significant support zone is breached. The vertical ascent from 1.74 to above 1.90 in just a few weeks underscores strong EUR demand and/or NZD weakness, possibly driven by fundamental factors such as diverging monetary policies or economic data surprises.
Looking ahead, a consolidation phase around 1.90 seems likely. If EUR/NZD holds above the 1.88–1.89 region, the market could build enough momentum for another leg higher. From a swing-trading standpoint, a clean break above 1.9050 sets the stage for a potential run toward 1.92. Some traders may even eye 1.95 as an extended target if bullish sentiment continues unabated over the coming weeks.
However, traders should keep an eye on volume indicators: if trading volumes recede significantly on any move above 1.90, it might hint at a lack of conviction, increasing the risk of a pullback. Monitoring how the pair behaves around the nine-period SMA and the middle Bollinger Band will also provide clues. Sustained closes below 1.88 might signal that the bullish trend is losing steam, paving the way for a more pronounced correction.
Read More: Swing Trading vs. Scalping: Which Strategy Suits You Best?
All in all, the technical setup favors further upside in EUR/NZD, but prudent risk management is essential given the pair’s volatile nature. The 1.88 level remains a key line in the sand for the bulls, while 1.9050–1.92 stands out as the next ceiling to breach. If the market breaks out on high volume and supportive fundamentals, traders may well see EUR/NZD test fresh highs in the weeks ahead.