
Sonic (SVM) has caught the attention of traders eager to see whether its next move will be a breakout toward $0.30—or a slip back near $0.25. Recent charts show notable fluctuations between these price levels, hinting at either a bullish push or a bearish fallback. In this article, we’ll dive into Sonic’s technical setup, analyze relevant indicators, and offer a measured outlook on where SVM might head next.
Read More: The Best Crypto Indicators for Long-Term Investing
1. Sonic’s Current Momentum
Sonic is trading around $0.27 on KuCoin, with its 24-hour range fluctuating from the mid-$0.26 mark to near $0.28. Meanwhile, on CoinGecko, the token’s broader market capitalization stands close to $1.88 billion, paired with a robust daily trading volume of over $180 million. That liquidity suggests an active market with plenty of buyers and sellers ready to move the price.
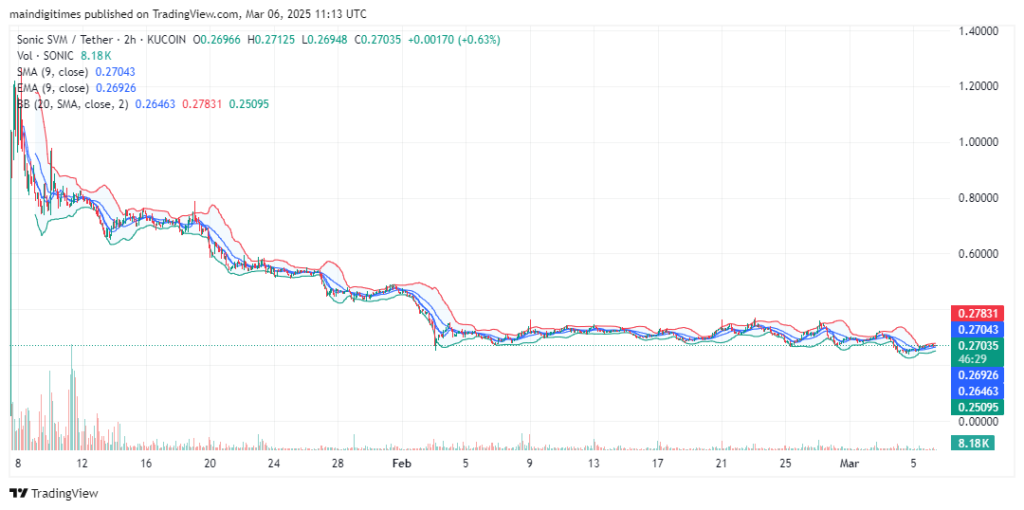
Looking at the two-hour chart, it’s evident that Sonic underwent a significant drawdown over the last few weeks, sliding from higher levels above $1.00 all the way down to the $0.20–$0.30 corridor. More recently, however, price action has steadied, trading in a narrower band and hinting that volatility may be easing.
The short-term five-minute and fifteen-minute charts reveal some intraday rebounds, with small peaks forming above $0.27 before retracing to test the mid-$0.26 zone. These mini-surge-and-pullback cycles often denote consolidation phases, especially when they align with an overall sideways pattern.
2. Trend Analysis & Technical Indicators
To gauge Sonic’s immediate trend, we can compare the price against commonly used moving averages. On the shorter timeframes (five-minute and fifteen-minute charts), SVM hovers right around its 9-period Simple Moving Average (SMA) and 9-period Exponential Moving Average (EMA), both near $0.27. The token’s 20-period Bollinger Bands are also closely wrapping the price at around $0.268 on the lower band and $0.271 on the upper band. Such tight clustering often foreshadows a significant price move—once the market decides on a direction.
On the two-hour chart, Sonic’s 9-period EMA (approximately $0.27) has occasionally acted as a dynamic resistance level, capping upward moves. However, the same moving average is now converging with the 20-period SMA, suggesting that SVM may be in a transitional zone between bullish and bearish territory. Volume levels have been fairly consistent, as evidenced by the daily turnover of $189 million, which should provide enough liquidity for notable price swings.
Without direct visibility of the RSI (Relative Strength Index) from the screenshots, we can infer from the sideways price action and stable volume that momentum might be hovering near the mid-level (around 50 on RSI). This reading implies a market that is currently neither overbought nor oversold—a scenario where the next significant catalyst could set the direction.
Here is a quick rundown of the critical technical signals:
- Sonic is consolidating around key moving averages (9SMA and 20SMA).
- Bollinger Bands have tightened, indicating reduced volatility.
- Volume remains steady, hinting at good liquidity for both buyers and sellers.
Read More: Swing Trading vs. Scalping: Which Strategy Suits You Best?
3. Price Outlook & Possible Scenarios
Given the current technical setup, Sonic seems poised for a decisive move. If SVM can break convincingly above $0.28, the next psychological target would be $0.30, a level that may attract momentum traders and potentially pave the way for a retest of higher resistance zones near $0.32. A bullish outcome would likely involve a spike in volume and a crossover where the 9-period EMA moves firmly above the 20-period SMA on the two-hour chart.
Conversely, if sellers take control and push the price below $0.26, the next area of support could lie around $0.25. A break under that floor might invite further bearish pressure, possibly extending to the $0.24 region last touched during previous dips. Such a scenario would likely coincide with an uptick in selling volume and a downward slope of short-term moving averages.
Traders should keep a close watch on overall market sentiment, especially for mid-cap tokens. While Sonic’s circulating supply of 3.175 billion tokens and active trading volume add stability, external market forces—such as Bitcoin’s fluctuations or general crypto sentiment—can nudge the price in unexpected ways. That makes risk management, including stop-loss placement and strategic position sizing, all the more crucial.
In summary, Sonic (SVM) currently sits in a neutral zone, consolidating around $0.27 with the potential to either bounce toward $0.30 or dip toward $0.25. Chart indicators and moving averages suggest a pivotal moment: Bollinger Bands are tight, and volume is solid. Watch for a decisive break of either $0.28 or $0.26 as the likely catalyst for Sonic’s next significant move. By combining technical awareness with prudent risk management, traders can stay prepared for whichever direction SVM ultimately takes