
Bitcoin, Ethereum, and Solana navigate through a volatile market phase. While Bitcoin consolidates below the $97,500 resistance, Ethereum fights to reclaim $2,720, and Solana tests critical support at $180, the charts tell a story of indecision—are we in for a breakout or further downside?
Technical indicators, including Fibonacci retracement levels, Bollinger Bands, and RSI, suggest that each of these top cryptocurrencies is at a pivotal moment.
Investors seeking direction will need to watch these levels closely, as a break or rejection could define the trend for the coming weeks.
Bitcoin (BTC) – Holding the Line at $96K, But For How Long?
Bitcoin’s price is currently hovering around $96,459, consolidating within a tight range. Despite several attempts, BTC has struggled to break above $97,500, which coincides with the 38.2% Fibonacci retracement level. This level has acted as strong resistance, preventing further upside.
On the downside, $95,500 has emerged as a critical support level, aligning with the 61.8% Fibonacci retracement, often considered a key reversal zone. A break below this level could open the door to $93,000 or even lower levels, as momentum remains neutral to slightly bearish.
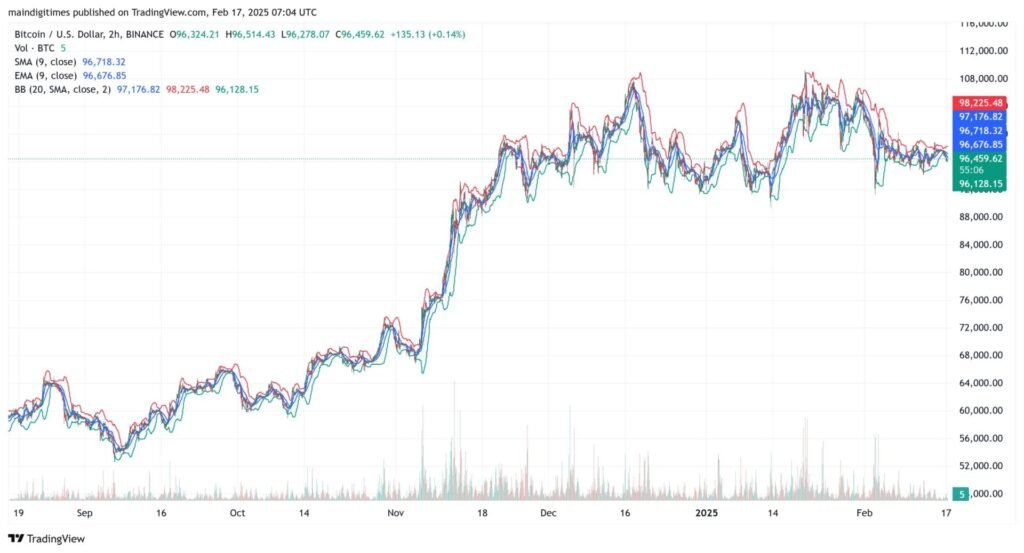
The Relative Strength Index (RSI) is hovering around 50, indicating a lack of strong momentum. If Bitcoin can climb above $97,500 and sustain it, the next target would be $100,000, a psychologically significant level. Until then, BTC remains in a state of indecision.
Read More: Bitcoin at a Crossroads: Will $98K Resistance Hold or Break?
Ethereum (ETH) – Bulls Need to Defend $2,650
Ethereum is facing its own battle, currently trading at $2,690. A break above $2,720 could trigger a move toward $2,800, but resistance has proven strong at this level. On the flip side, $2,650 serves as critical support, and a drop below it could push ETH toward $2,600 or lower.
Similar to Bitcoin, Ethereum’s RSI is neutral, showing that the market lacks a clear trend. The Bollinger Bands indicate reduced volatility, suggesting a breakout could be imminent. If ETH stays above $2,650 and gains momentum, a surge to $2,800 or even $3,000 could be on the table.

Solana (SOL) – Holding the Last Line of Defense at $180
Solana has been on a downtrend after failing to hold above $198, a level that aligned with the upper Bollinger Band. Now, the price has retraced to $183.76, sitting just above a key support zone at $180.
Fibonacci levels suggest that if $180 fails, Solana could drop toward $170, marking a deeper correction. However, if buyers step in at these levels, a reversal toward $190 and eventually $200+ is possible.
The RSI for SOL is trending downward, but if it enters oversold territory below 40, it could indicate a buying opportunity. Traders should watch for a strong bounce from $180 as a sign of renewed momentum.

Market Outlook – A Breakout or Further Decline?
The broader trend remains uncertain, with Bitcoin, Ethereum, and Solana all at key decision points. The lack of strong momentum suggests that a significant move could be brewing, but the direction remains unclear.
Bullish Scenario:
- BTC breaking $97,500 could send it toward $100K.
- ETH reclaiming $2,720 could lead to a test of $2,800.
- SOL bouncing from $180 could push it back toward $200.
Bearish Scenario:
- BTC falling below $95,500 could result in a move toward $93K.
- ETH losing $2,650 support might trigger a drop to $2,600.
- SOL breaking below $180 could open the door for $170 or lower.
Read More: FistToken (FIST) Soars 80% as $242K DEX Outflows Signal Accumulation
For now, traders should remain cautious, watching for volume spikes, RSI movement, and reactions at key support/resistance levels. Whether a breakout or a deeper correction is ahead, this moment of indecision won’t last forever.