The USD/JPY pair has experienced notable fluctuations in recent trading sessions, reflecting a mix of global economic sentiment, interest rate differentials, and geopolitical influences. The pair’s recent movement hints at a consolidation phase with potential breakout signals, making it a key focus for traders. By analyzing the 1-day, 5-day, and 6-month charts, we can gain insights into the current market dynamics and identify actionable trading opportunities.
1-Day Chart Analysis: Navigating Short-Term Volatility

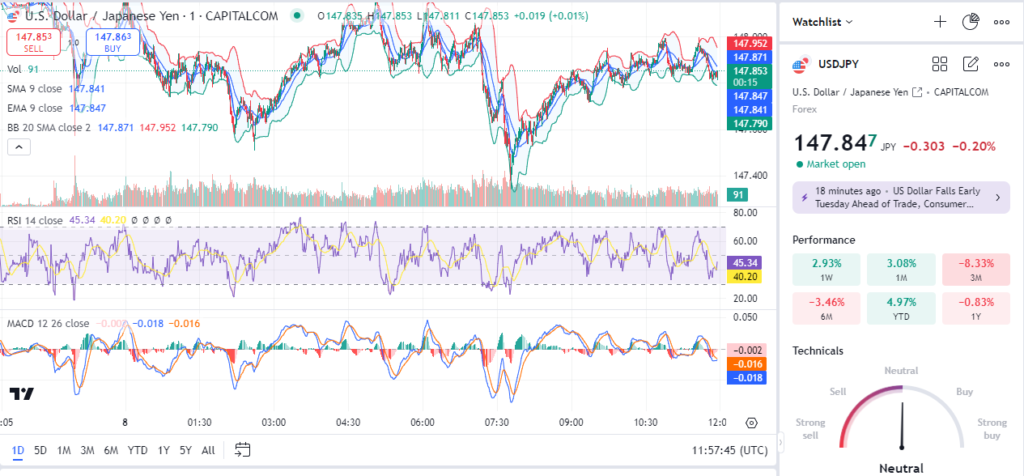
The 1-day chart of USD/JPY shows that the pair is currently trading around the 147.85 level. The price movements are characterized by a series of short-term swings, reflecting market uncertainty. The RSI (Relative Strength Index) is at 45.34, indicating a slight bearish bias but not yet in oversold territory, suggesting room for further price movement either downward or upward.
The Bollinger Bands (BB) are tightening, signaling a decrease in volatility, which often precedes a significant price movement. The current price is close to the 9-period SMA (Simple Moving Average) at 147.841 and the EMA (Exponential Moving Average) at 147.847. This proximity suggests that the market lacks a strong directional bias, with the price hovering around key short-term averages. Additionally, the MACD (Moving Average Convergence Divergence) shows a slight bearish crossover, indicating potential downward pressure in the near term.
Traders should be cautious of potential reversals or breakouts from the current consolidation phase. A move below 147.79 could lead to further downside, while a break above 148.00 might trigger a bullish run.
Read More: EUR/GBP Technical Analysis: Key Levels and Trade Ideas – Oct 8
5-Day Chart Analysis: Tracking Intermediate Trends

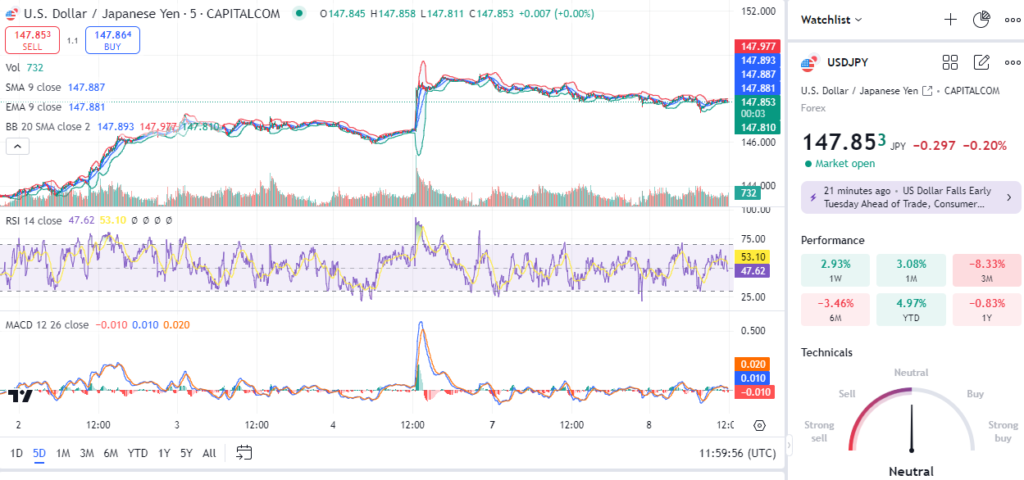
The 5-day chart offers a broader perspective of the USD/JPY pair’s price action, highlighting recent market trends and potential turning points. The pair has seen a minor pullback after testing the 148.00 level, now hovering around 147.85. The RSI is at 47.62, suggesting that the pair is nearing a neutral zone, indicating neither strong buying nor selling pressure.
Volume indicators reveal moderate trading activity, with some spikes corresponding to recent news events affecting the US dollar. The MACD shows a flattening pattern, hinting at a potential shift in momentum, though no clear signal is evident yet. Traders should monitor this closely for any further crossover, which could provide an early indication of a trend shift.
From a technical standpoint, the price is balancing near the short-term moving averages (SMA and EMA). If USD/JPY manages to maintain its position above the SMA of 147.887, it could regain bullish momentum. However, a drop below 147.80 may suggest a continuation of the short-term correction. This intermediate timeframe can be pivotal for swing traders looking to capitalize on 50-100 pip movements.
6-Month Chart Analysis: Long-Term Outlook and Key Levels

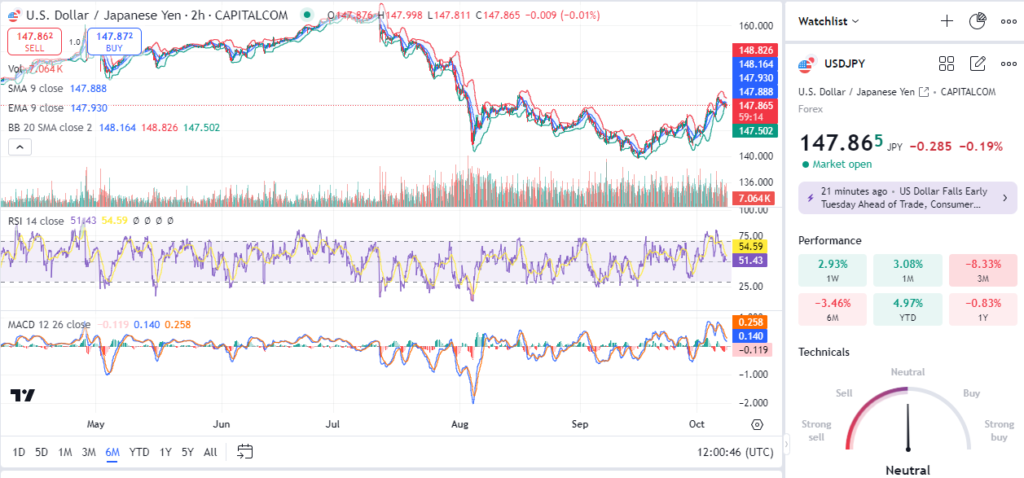
Analyzing the 6-month chart of USD/JPY reveals a more comprehensive view of the pair’s overall trajectory. The long-term trend has been upward, driven by the divergent monetary policies of the US Federal Reserve and the Bank of Japan, resulting in the pair peaking above the 148.00 mark before facing resistance.
The RSI is positioned at 51.43, indicating that the pair is in a balanced state with no extreme overbought or oversold conditions. This suggests a potential continuation of the consolidation phase, unless a fundamental catalyst drives a new trend. The MACD indicates bullish momentum with positive divergence, but the recent slowdown suggests that the momentum is weakening.
The Bollinger Bands indicate a gradual expansion, suggesting that volatility may increase in the upcoming weeks. Key support levels include 147.50 and 146.80, while resistance is seen at 148.20 and 149.00. A break above these resistance levels could signal a continuation of the broader uptrend, targeting the 150.00 psychological level.
Read More: XRP/USD Technical Analysis: Key Levels and Trade Ideas – Oct 7
Trade Ideas: Strategy and Risk Management
Based on the technical analysis across these timeframes, here are some actionable trade ideas:
1. Bullish Trade Idea:
- Entry Point: Consider entering a long position if USD/JPY breaks above 148.20, signaling renewed upward momentum.
- Take-Profit Levels: Set the first take-profit at 149.00, and the second at 149.80 for those aiming for a more extended rally.
- Stop-Loss: Place a stop-loss at 147.60 to limit downside risk in case of a reversal.
- Risk Management Tip: Allocate no more than 2% of your trading capital on this position, ensuring adequate protection against unexpected market movements.
2. Bearish Trade Idea:
- Entry Point: Consider a short position if the pair breaks below the 147.50 support level, indicating a potential downside continuation.
- Take-Profit Levels: Aim for 146.80 as the first target and 146.00 as an extended target.
- Stop-Loss: Set a stop-loss at 148.20 to mitigate the risk of a sharp upward reversal.
- Risk Management Tip: Use a trailing stop to lock in profits as the trade moves in your favor, reducing the potential impact of sudden retracements.
3. Range-Bound Strategy:
- Entry Points: If the price remains between 147.50 and 148.20, consider trading within the range by buying near the support (147.50) and selling near the resistance (148.20).
- Stop-Loss: For long positions, place a stop-loss below 147.20, and for short positions, above 148.50.
- Risk Management Tip: This strategy works best in low-volatility conditions, so monitor the Bollinger Bands for any signs of expansion, which could indicate the end of the range-bound phase.
Overall Risk Management Tips:
- Position Sizing: Always adjust your position size based on your risk tolerance and the distance between your entry and stop-loss levels. This helps in maintaining a consistent risk-to-reward ratio.
- Stay Updated with Fundamentals: Given the influence of macroeconomic factors on USD/JPY, keep an eye on economic data releases such as US Non-Farm Payrolls, Japanese inflation data, and central bank announcements.
- Use Alerts: Set alerts for key levels such as 148.20 and 147.50 on your trading platform to ensure timely reactions to market movements.
Conclusion
The USD/JPY pair presents a range of trading opportunities as it navigates through different timeframes. The current technical setup suggests a balanced market with potential for both upside and downside moves. Traders should focus on key levels, monitor momentum indicators, and adopt a disciplined approach to trade management. Whether employing a trend-following or range-bound strategy, staying attentive to both technical signals and macroeconomic developments will be key to success in the dynamic USD/JPY market.


