The XAG/USD trading pair has recently exhibited notable price action, reflecting heightened volatility in the broader commodities market. Silver prices have been buoyed by a combination of global economic uncertainty and a weakening US dollar, which has sparked renewed investor interest in safe-haven assets. The recent performance of XAG/USD shows a bullish trend, with silver gaining momentum, particularly after the Federal Reserve’s dovish stance, which bolstered expectations of lower interest rates. This article provides a detailed technical analysis of the XAG/USD pair over three different timeframes: 1-day, 5-day, and 6-months, followed by actionable trade ideas for traders looking to capitalize on potential market moves.
1-Day Chart Analysis

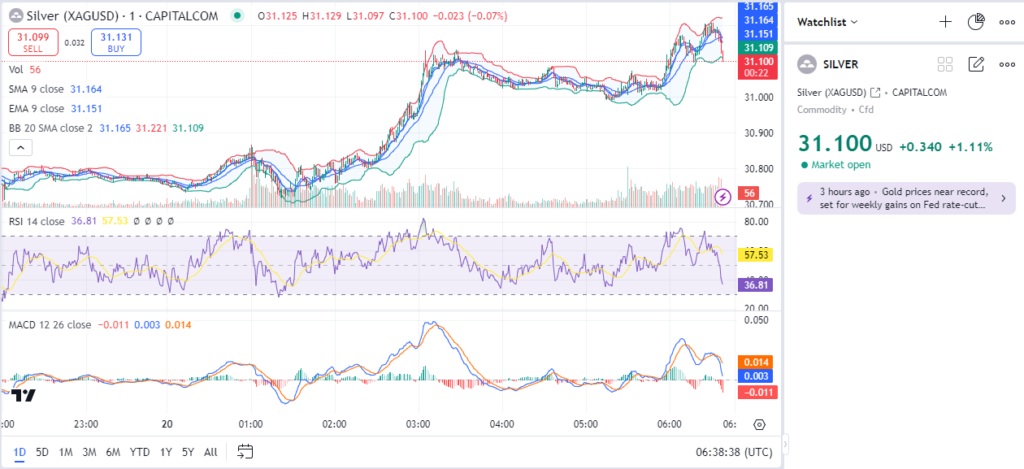
The 1-day chart indicates that the XAG/USD pair is currently trading around $31.10, showing a slight decrease from its recent peak of approximately $31.13. The Bollinger Bands are narrowing, suggesting a decrease in volatility, while the price is hovering near the lower band, which could indicate a potential reversal or consolidation phase.
The Relative Strength Index (RSI) is around 36.81, signaling that silver is approaching the oversold territory. This is often a precursor to a bullish reversal if buying pressure resumes. The Moving Average Convergence Divergence (MACD) indicator shows a minor bearish crossover, with the signal line above the MACD line, indicating a potential continuation of the short-term downtrend.
The 9-period Simple Moving Average (SMA) and the 9-period Exponential Moving Average (EMA) are converging around the $31.16 level, acting as resistance. A break above these levels could see XAG/USD retest the $31.20-$31.30 zone, while failure to hold current levels may lead to a test of the $30.90 support level.
Read More: XAU/USD Technical Analysis: Key Levels and Trade Ideas – Sep 20
5-Day Chart Analysis

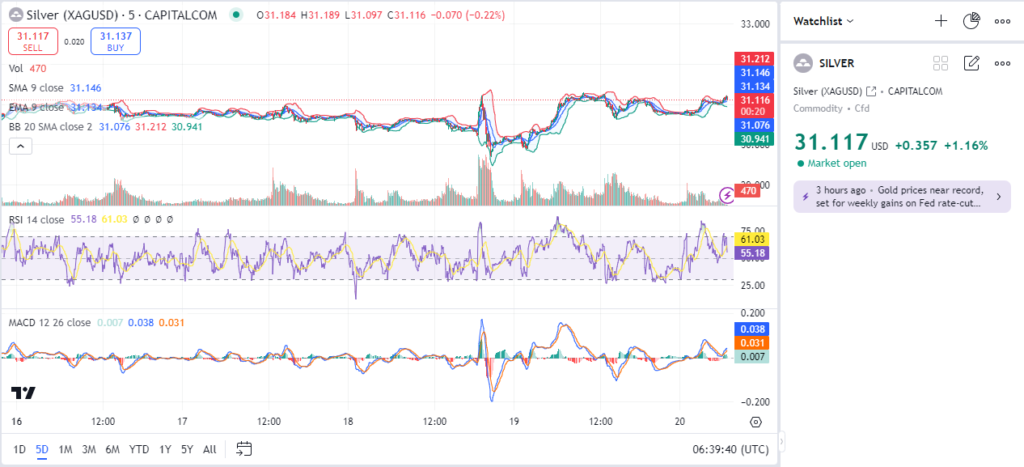
In the 5-day chart, XAG/USD appears to be consolidating within a tight range between $31.10 and $31.20, following a brief rally earlier in the week. The Bollinger Bands are relatively flat, suggesting a lack of clear directional momentum. The RSI is around 55.18, indicating neutral market conditions without any clear overbought or oversold signals.
The MACD line is marginally above the signal line, reflecting a weak bullish sentiment. However, the low volume and the flat moving averages indicate indecision among market participants. The 9-period SMA and EMA are aligned around the $31.14 level, serving as immediate resistance.
A sustained break above $31.20 could potentially lead to a move towards the $31.35-$31.40 range, whereas a break below $31.10 might see a decline towards $30.90, a critical support level. Traders should look for a decisive breakout from this range for a clearer directional bias.
6-Month Chart Analysis

The 6-month chart provides a broader perspective, with XAG/USD exhibiting a long-term uptrend, having rebounded from lows of around $22.50 in early March to its current levels above $31.00. The Bollinger Bands are expanding, reflecting the increased volatility over the past few months, while the price remains close to the upper band, indicating strong bullish momentum.
The RSI is around 59.87, still below the overbought threshold but suggesting that the asset could see further upside if the bullish trend continues. The MACD indicator shows a strong bullish crossover, with the MACD line well above the signal line, confirming the positive sentiment in the long term.
The 9-period SMA and EMA are both supporting the uptrend, acting as dynamic support levels around the $30.95 mark. If XAG/USD can sustain above this level, it could continue to target the $32.00 psychological resistance level. However, a failure to maintain the current momentum may lead to a pullback towards the $30.70-$30.50 support zone.
Read More: ETH/USDT Technical Analysis: Key Levels and Trade Ideas – Sep 20
Trade Ideas and Strategy
1. Long Position:
- Entry: Consider entering a long position if XAG/USD breaks above the $31.20 resistance level on the 1-day or 5-day chart with a sustained volume increase.
- Target: Aim for a target price of $31.50, followed by $31.70 if the bullish momentum persists.
- Stop-Loss: Place a stop-loss below the $30.90 support level to limit downside risk.
- Risk Management: Use a 2% position size relative to your trading capital and avoid over-leveraging in a highly volatile market.
2. Short Position:
- Entry: Consider shorting if XAG/USD fails to hold above the $31.00 level and breaks below the $30.90 support level with increased bearish volume.
- Target: Target a downside move towards $30.70, with an extended target at $30.50.
- Stop-Loss: Place a stop-loss above the $31.30 resistance to protect against sudden bullish reversals.
- Risk Management: Limit position size to 1-2% of trading capital, considering the higher risk in a potentially bullish market environment.
Conclusion
The XAG/USD trading pair presents both short-term and long-term opportunities depending on market conditions and risk tolerance. The 1-day chart suggests caution due to the narrowing Bollinger Bands and bearish MACD, while the 5-day chart reflects consolidation with no clear direction. The 6-month chart, however, supports a bullish outlook with strong momentum indicators. Traders should be prepared to adjust their strategies based on evolving market conditions and stay vigilant for breakout signals in either direction.


