Dogecoin (DOGE), a popular meme cryptocurrency, has experienced significant volatility in recent weeks, sparking interest among both retail traders and long-term investors. DOGE has historically been subject to rapid price movements, largely driven by market sentiment and social media influence. However, technical indicators offer insights into potential price action over various timeframes, providing traders with an opportunity to make more informed decisions. In this article, we delve into the technical analysis of DOGE/USDT using 1-day, 5-day, and 6-month charts to uncover trends and forecast price movements.
1-Day Price Analysis

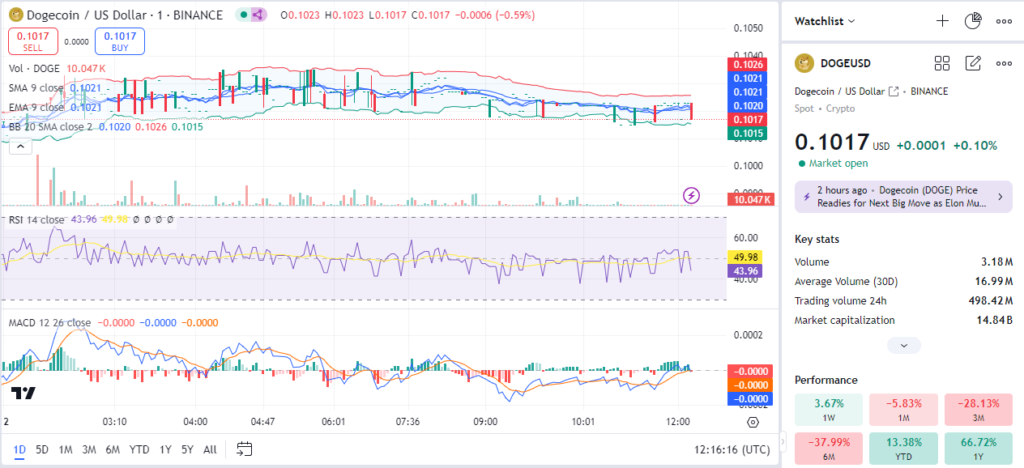
Looking at the 1-day DOGE/USDT chart, we observe that Dogecoin is trading at $0.1017, with a slight uptick in the last 24 hours. The chart is showcasing significant sideways movement, with Bollinger Bands indicating consolidation as price remains compressed between upper and lower bands. The price is hovering around the 9-period SMA and EMA, both showing little divergence, which suggests indecision in the market.
The RSI (Relative Strength Index) is currently sitting at around 43.96, indicating that the market is neither overbought nor oversold. This aligns with the sideways action seen in the Bollinger Bands, confirming the lack of strong bullish or bearish momentum. Meanwhile, the MACD (Moving Average Convergence Divergence) is showing weak momentum, with both the signal line and MACD line nearly converged, which further reinforces the neutral trend in the short term.
Read More: MANA, GRT, AAVE See Increased Short Positions – Time to Sell?
5-Day Price Analysis

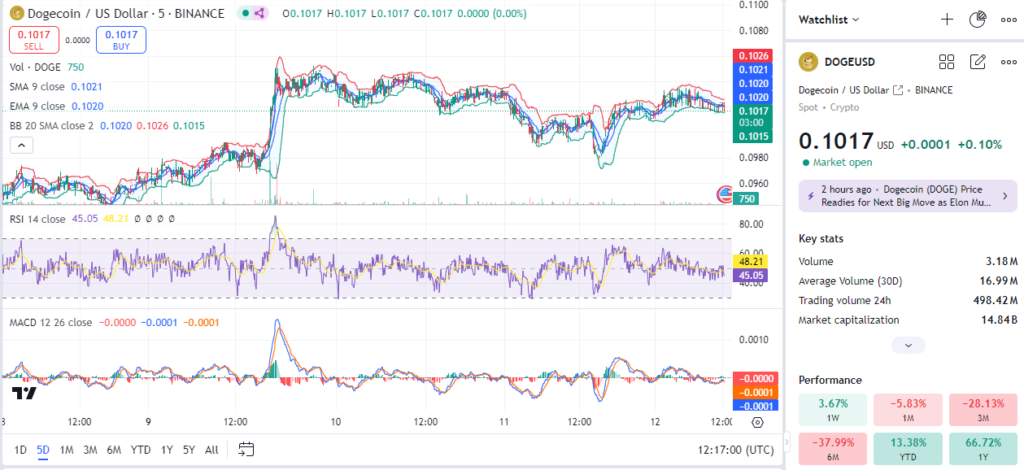
Zooming out to the 5-day chart, Dogecoin displays more noticeable fluctuations. The price has attempted several breakouts, hitting a high of $0.1023 during this period, but has failed to maintain upward momentum, dropping back to the $0.1015 – $0.1017 range. The SMA and EMA are close to each other and continue to move in a relatively flat direction, signaling minimal directional bias.
The RSI has decreased slightly compared to the 1-day chart, now resting around 45.05, which still indicates neutral momentum. A sharp divergence in the MACD, with a brief bullish crossover followed by a quick retrace, suggests a lack of strong follow-through on recent bullish attempts.
Volume has also been relatively low, which suggests that traders are waiting for a clear breakout signal before entering substantial positions. This 5-day chart presents a market in equilibrium, where neither buyers nor sellers are in control, making it an ideal setup for range-bound strategies.
6-Month Price Analysis

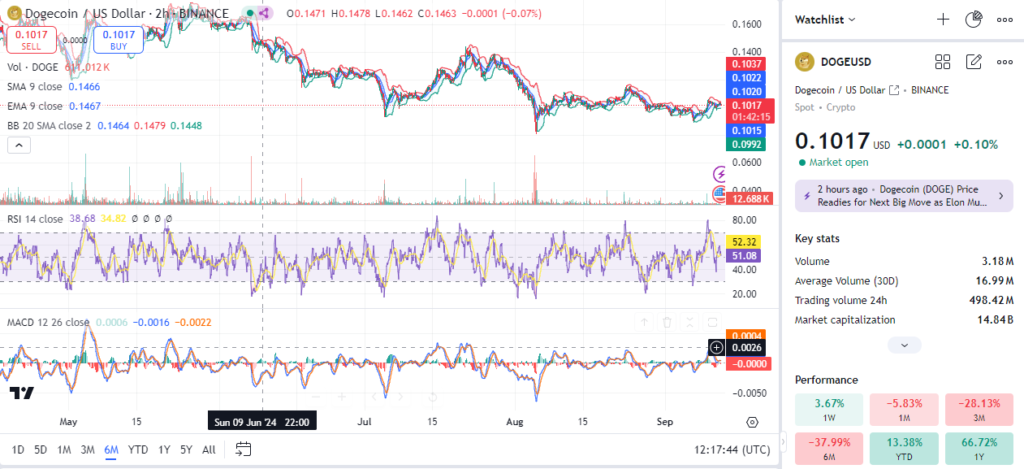
Analyzing the 6-month chart provides a broader perspective on DOGE’s price action. Over this period, the price has experienced a significant decline from its highs of around $0.1478 to its current levels around $0.1017. The overall trend appears bearish, as indicated by the longer-term moving averages (SMA and EMA), which are trending downward, with the price trading well below both of them.
The RSI on the 6-month chart shows a more bearish reading of 34.82, suggesting that DOGE is approaching oversold territory. However, it’s important to note that the market has bounced from these levels in the past, making this a potential accumulation zone for traders looking for a long-term rebound.
The MACD line, after a prolonged bearish movement, is starting to show signs of stabilization, though it remains below the signal line, confirming that selling pressure has been dominant over the past several months. Volume on the 6-month chart is notably higher compared to the shorter-term charts, suggesting that this recent downward trend has seen participation from larger market players.
Read More: LUCI Price Surges Almost 1,000% as Fresh Wallets Receive $3M Worth of Token
Trade Ideas and Strategy
Given the technical indicators across all three timeframes, here are some actionable trade ideas for DOGE/USDT:
- Range-Bound Strategy (Short-Term):
- Entry Point: Consider entering a long position if the price breaks above $0.1025, as this level represents the upper Bollinger Band on the 1-day chart. A strong breakout above this level could signal the start of a new bullish move.
- Stop-Loss: Set a stop-loss below $0.1010 to protect against false breakouts, as this would indicate that the market remains in consolidation.
- Exit Point: Target an exit around $0.1035, where resistance may come into play based on previous highs in the 5-day chart.
- Risk Management: Use a risk-reward ratio of 1:2, risking 1% of your capital for a potential 2% gain on this trade.
- Breakout Strategy (Mid-Term):
- Entry Point: If the price breaks above the $0.1050 level seen in the 5-day chart, this could indicate a more sustained bullish breakout. Consider entering a long position around $0.1055 after confirmation.
- Stop-Loss: A stop-loss below $0.1030 would help minimize potential losses, as a fall below this level could invalidate the breakout.
- Exit Point: A potential exit target would be $0.1100, which is a psychological level and has shown resistance in the past.
- Risk Management: Aim for a risk-reward ratio of 1:3, risking 1% for a potential 3% return.
- Long-Term Accumulation:
- Entry Point: For long-term investors, the current price near $0.1015 represents a potential accumulation zone, especially given that the RSI is nearing oversold levels on the 6-month chart.
- Stop-Loss: A wide stop-loss around $0.0990 should be considered, as this allows for market fluctuations while preserving capital in case of a deeper correction.
- Exit Point: Target an exit around $0.1200 – $0.1250, where previous resistance lies based on historical data.
- Risk Management: Given the larger timeframe, use a smaller position size to manage risk while aiming for a risk-reward ratio of 1:4 or higher.
Conclusion
DOGE/USDT presents several trading opportunities across various timeframes. The short-term charts show a market in consolidation, ideal for range-bound traders, while the mid-term charts hint at potential breakouts that could offer opportunities for traders willing to take on more risk. Long-term investors may find the current price levels attractive for accumulation, given that key indicators like the RSI suggest that DOGE is approaching oversold conditions. As always, it’s essential to use proper risk management strategies, including setting stop-losses and taking profits at key levels, to minimize risk and maximize potential gains.


